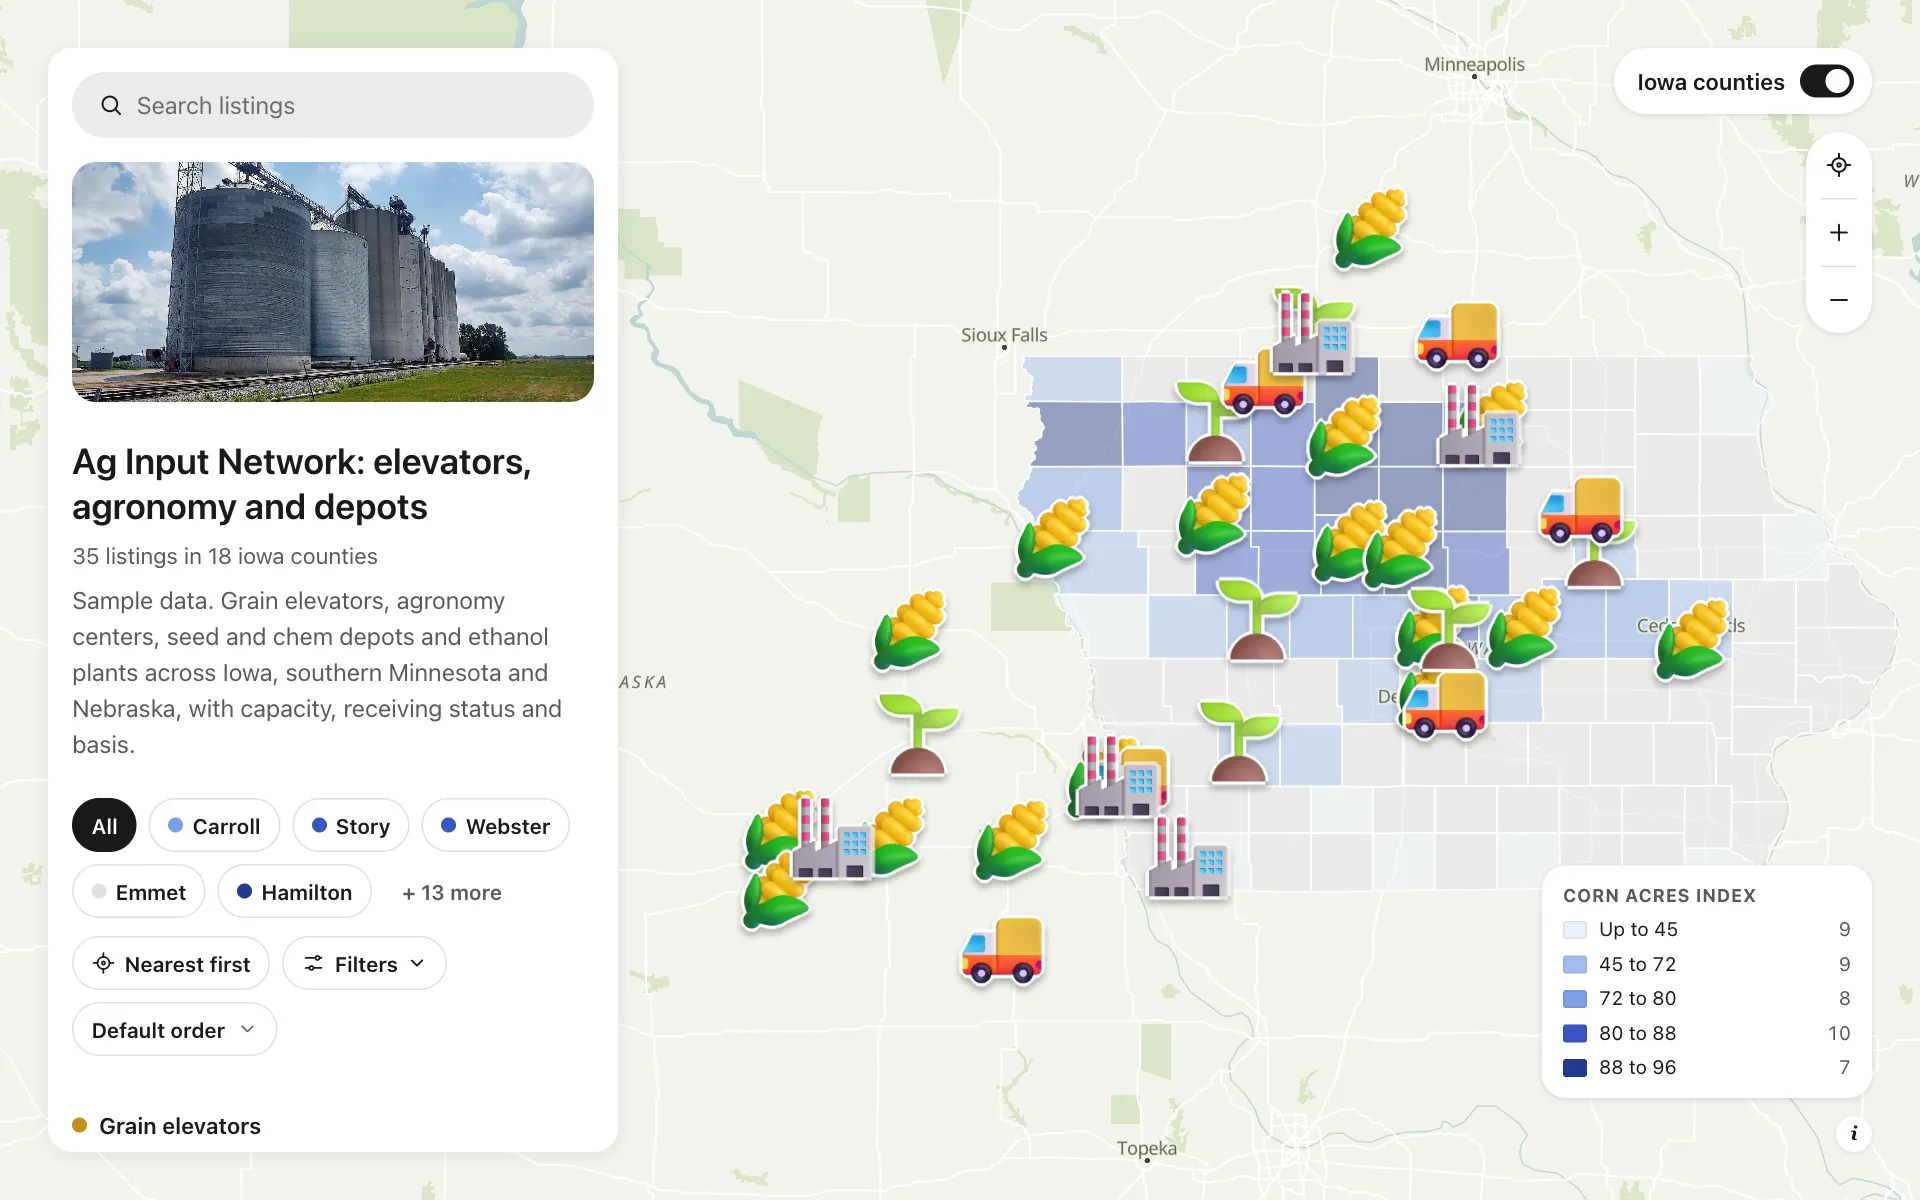
Ag input and grain network
A working map for an invented ag input and grain network across Iowa, southern Minnesota and Nebraska. Seventeen grain elevators show storage in thousand bushels, whether they are receiving today and the basis against nearby futures. Agronomy centers, seed and chem depots and ethanol plants sit on a county map shaded by corn acres. Farmers filter for open elevators and call from the map, and your dispatcher stops answering the same where-can-I-deliver call all day.
A sample map: its businesses and people are invented.
Who needs a map like this
Who it’s for
Operations and agronomy leaders at ag co-ops, seed and chemical distributors and grain handlers
What it’s worth
At planting and harvest every hour of truck time counts. One map of elevators with capacity, receiving status and basis lets farmers pick the closest open elevator, and lets you shift trucks and staff to where the lines are.
What to notice in this map
- Counties shaded by corn acres, so demand is visible before a single pin
- Filter by receiving status: Open, Limited or Closed
- Storage in thousand bushels as a list column and a range filter
- Services filter: grain, seed, chemicals, fertilizer, agronomy, fuel
- A Call the elevator button on every place
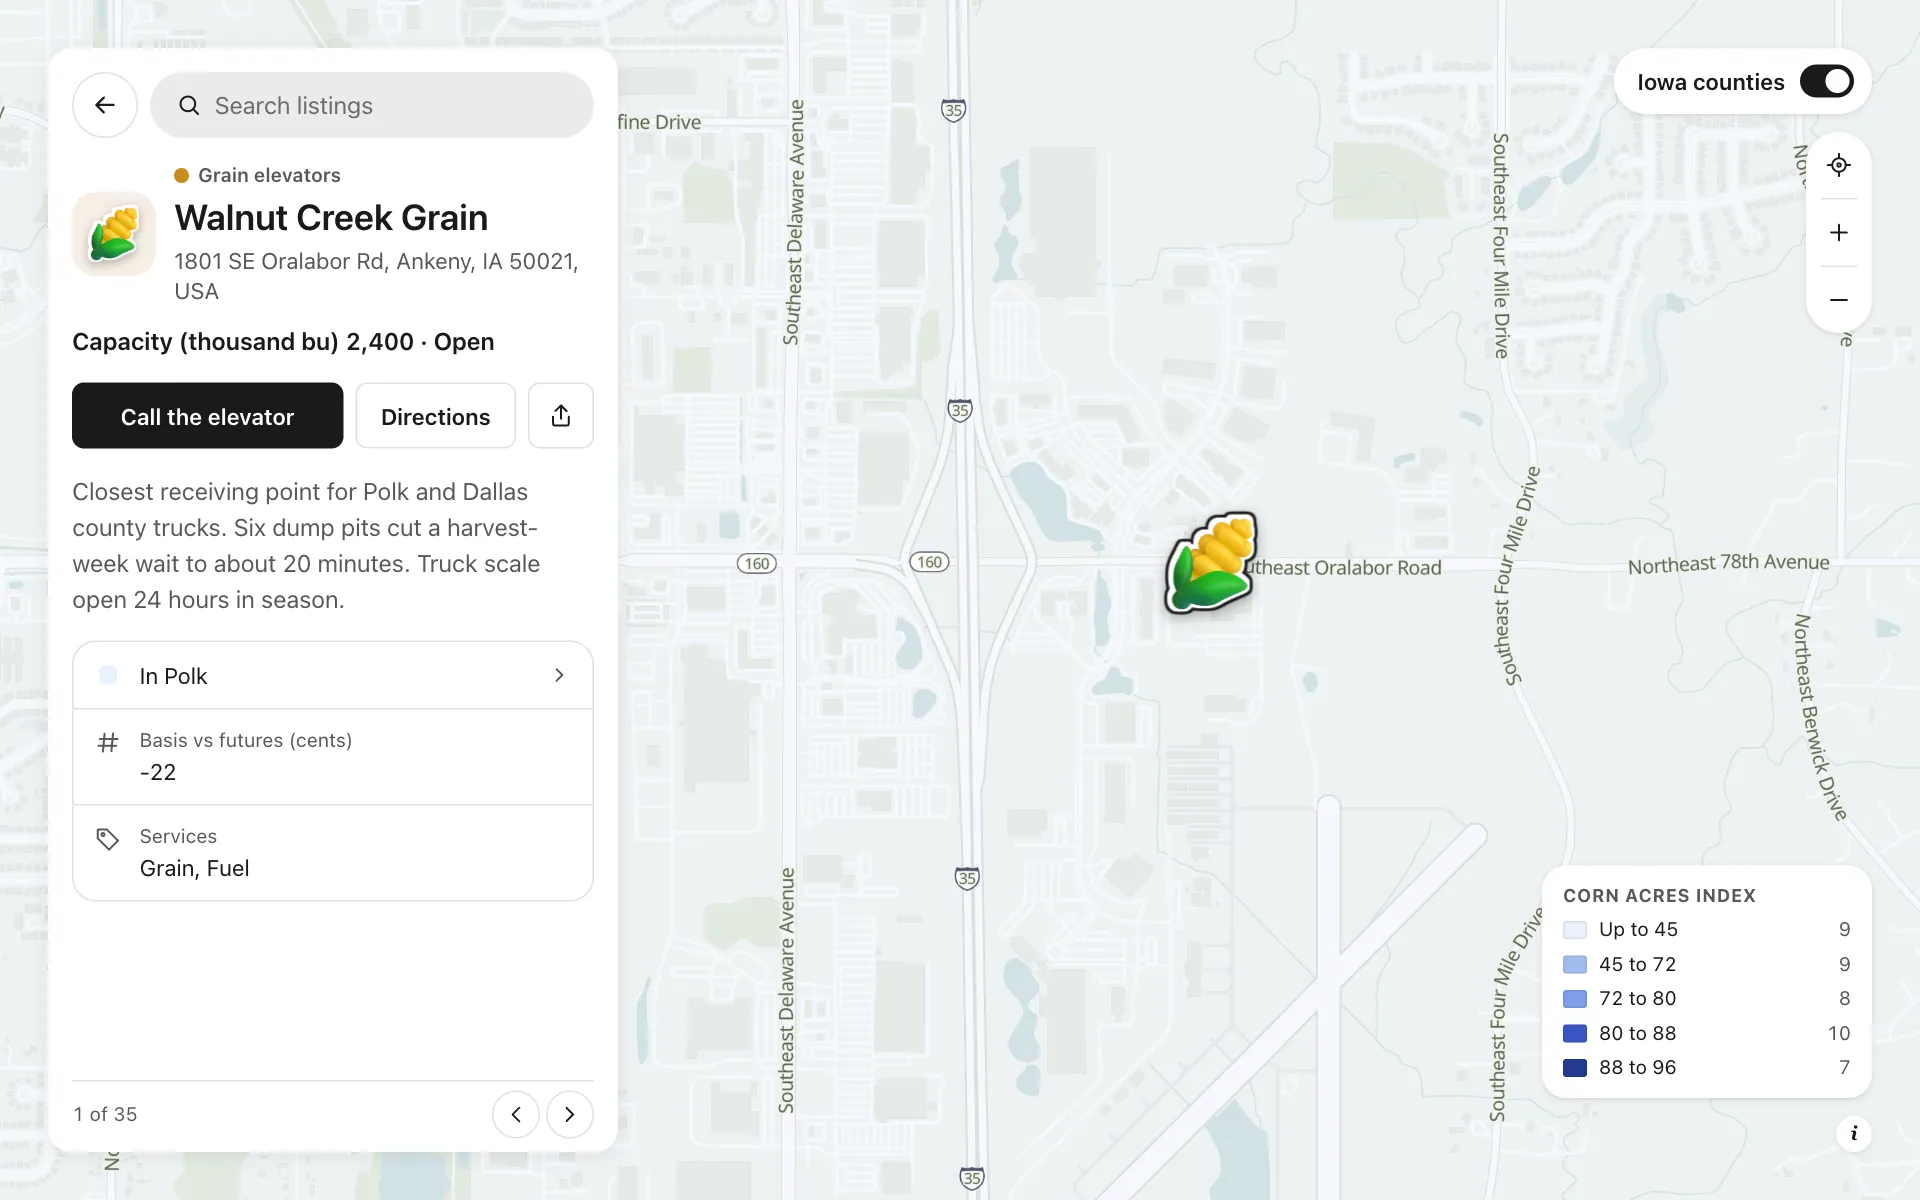
Open any place on the map to see its details and buttons.
Make one like it in an afternoon
You don't need a developer. These are the four steps, in Create Mappins.
Step 1
Create a directory map and add your elevators, agronomy centers, depots and plants as places in four categories.
Step 2
Add fields: a number for storage, a choice for receiving status, a number for basis, a multiple choice for services and a phone field with the button label Call the elevator.
Step 3
Open the data library, add the US counties layer, show only Iowa, and shade it by a written numeric column such as corn acres.
Step 4
Pick a base style, set the opening view, then publish the map and embed it on your grain bids page.
More maps like this
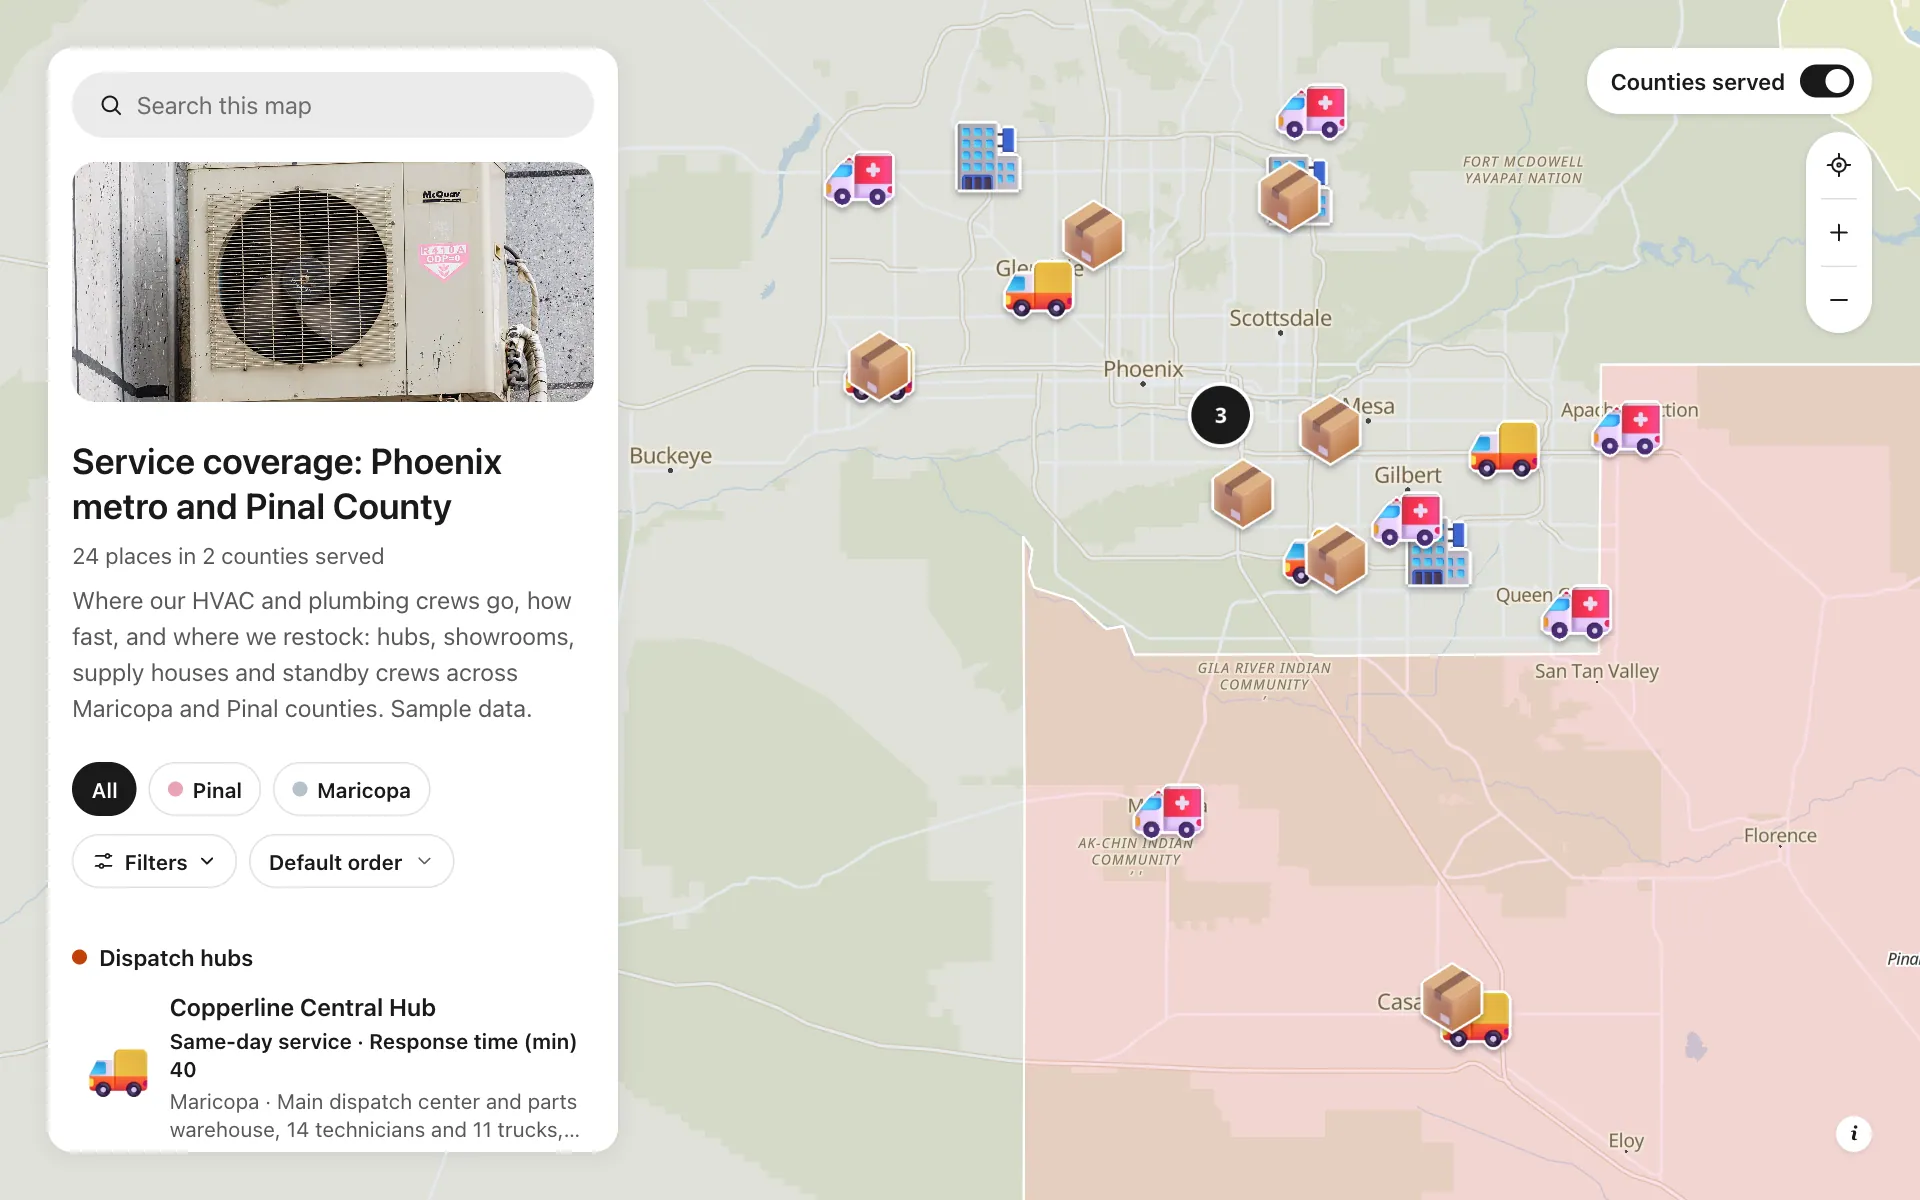
Service area and dispatch map
Dispatch hubs, same-day zones, supply houses and standby crews, shown on one coverage map.
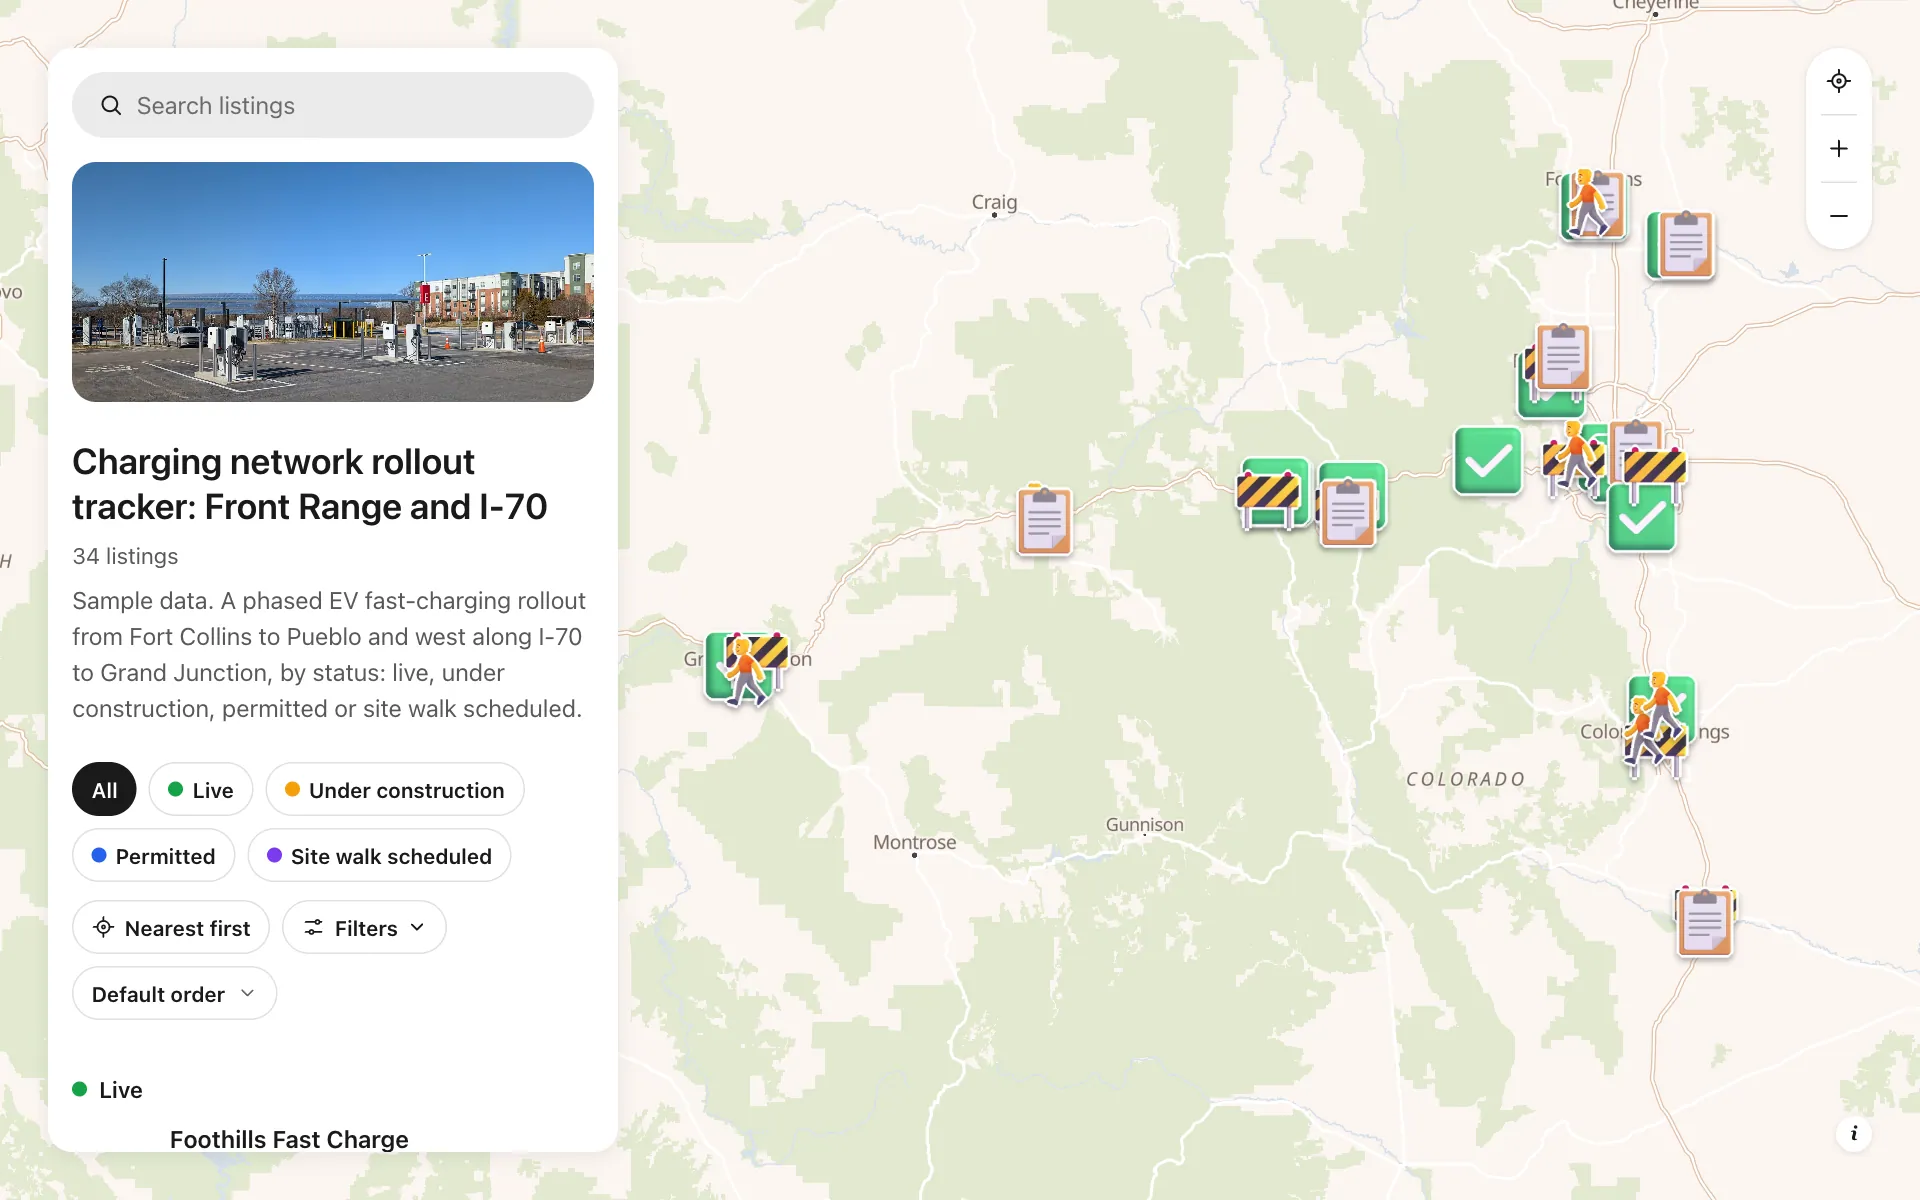
EV charging rollout tracker
34 sites from Fort Collins to Grand Junction by status, power, stalls and host type, with a host contact line.
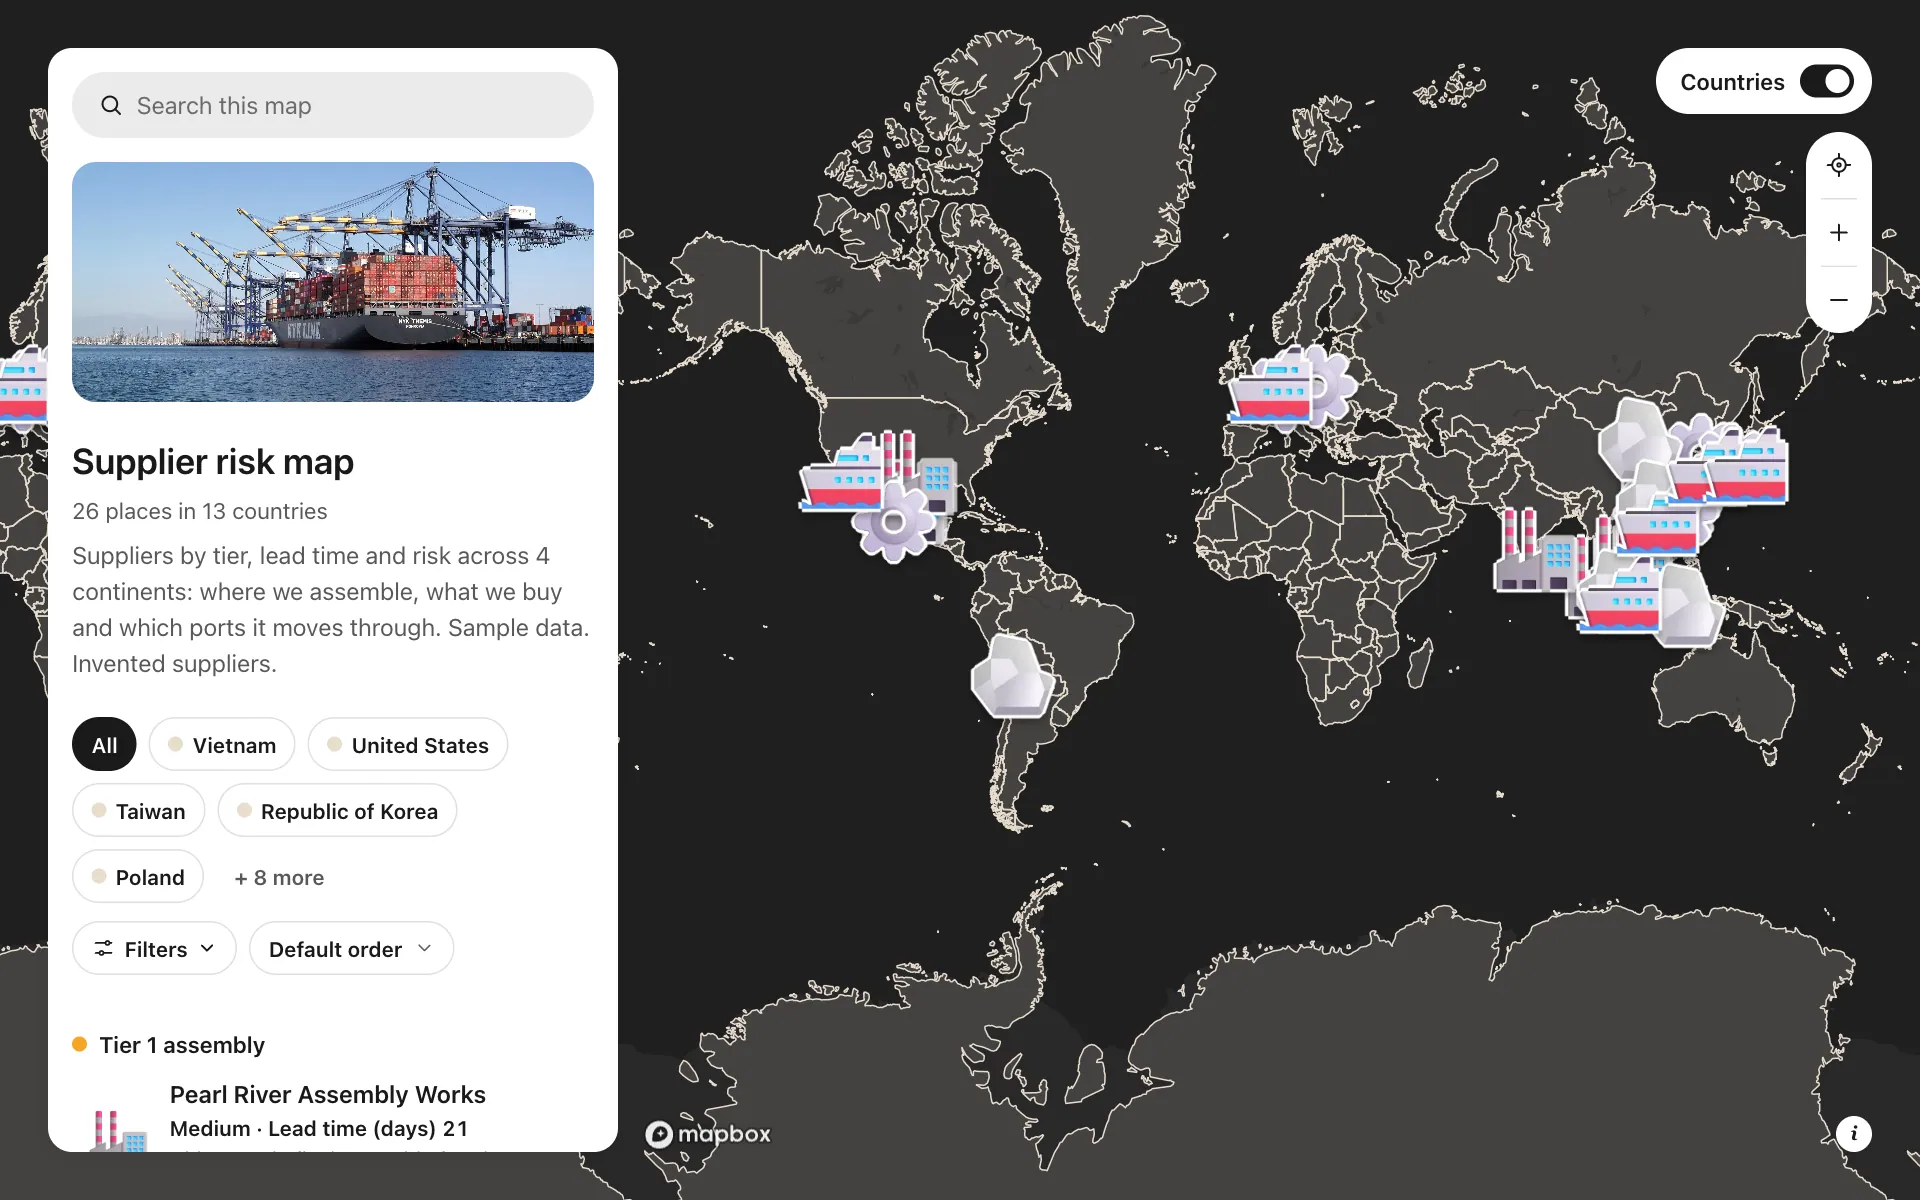
Supplier risk map
Suppliers by tier, lead time and risk, so concentration shows at a glance.
Build the map your business needs
Start free: up to 3 maps. Import your own data, add photos and details, and share one link.