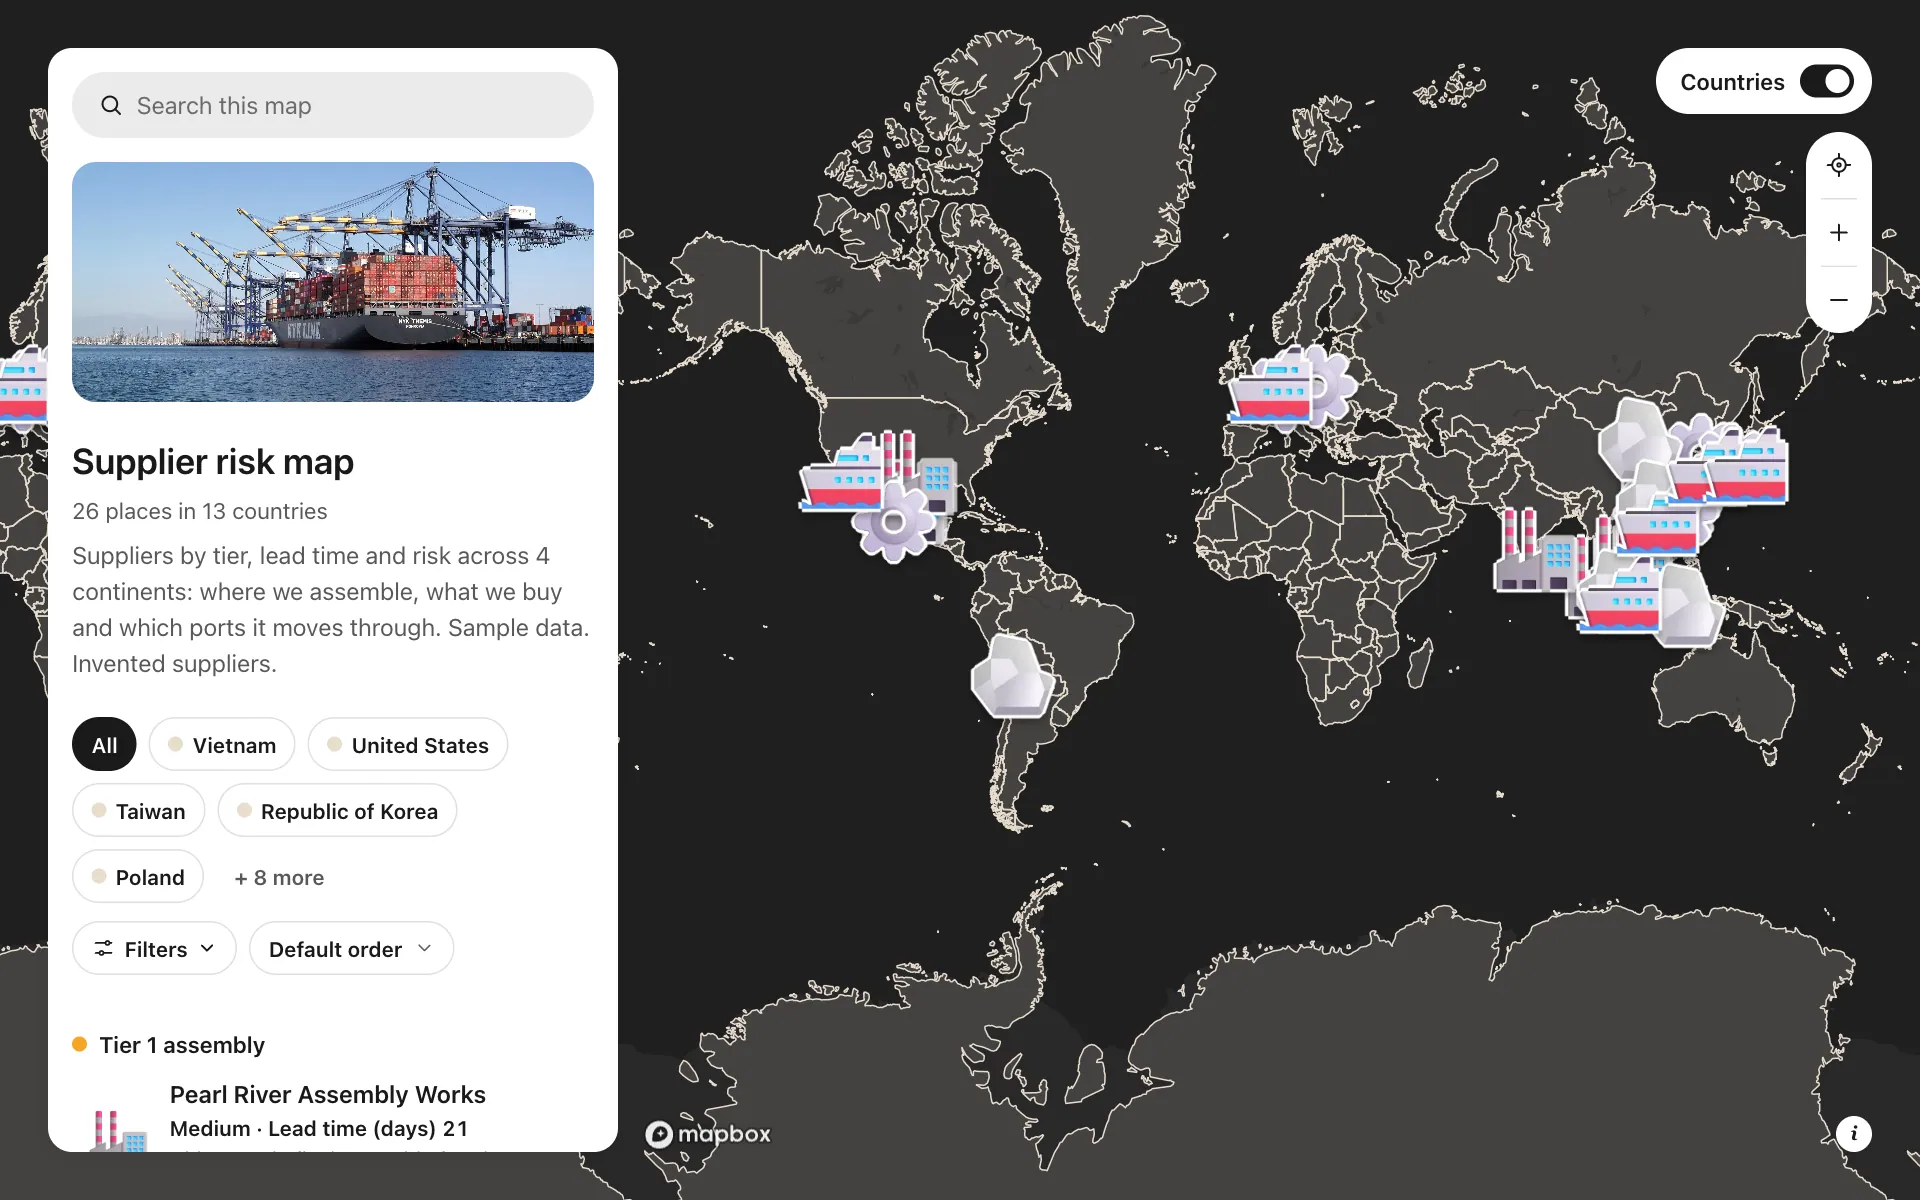
Supplier risk map
This map puts a consumer-electronics maker's supply chain on one screen: assembly plants, component suppliers, raw materials and ports, each colored by tier. Every place carries its lead time, risk rating, certifications, share of spend and whether a part is single-sourced. Filter to High risk or single-source parts and the weak points stand out, like four critical sites within 80 km of Shenzhen. Share the link with finance and the CEO, and everyone looks at the same picture.
A sample map: its businesses and people are invented.
Who needs a map like this
Who it’s for
Procurement, supply chain and operations leads at mid-size manufacturers and brands
What it’s worth
When the board asks "what happens if Shenzhen closes", you answer in the meeting, not after a week of spreadsheets. Seeing risk and concentration on one map helps you move orders before a shortage costs you sales.
What to notice in this map
- Four tiers, each in its own color on a dark base
- Risk rating and lead time on every row of the list
- Filters for risk, lead time, certification and single-source parts
- High-risk places with a concrete reason: one port, one fab, a flood-prone site
- Shenzhen, Dongguan and Yantian clustered to show regional concentration
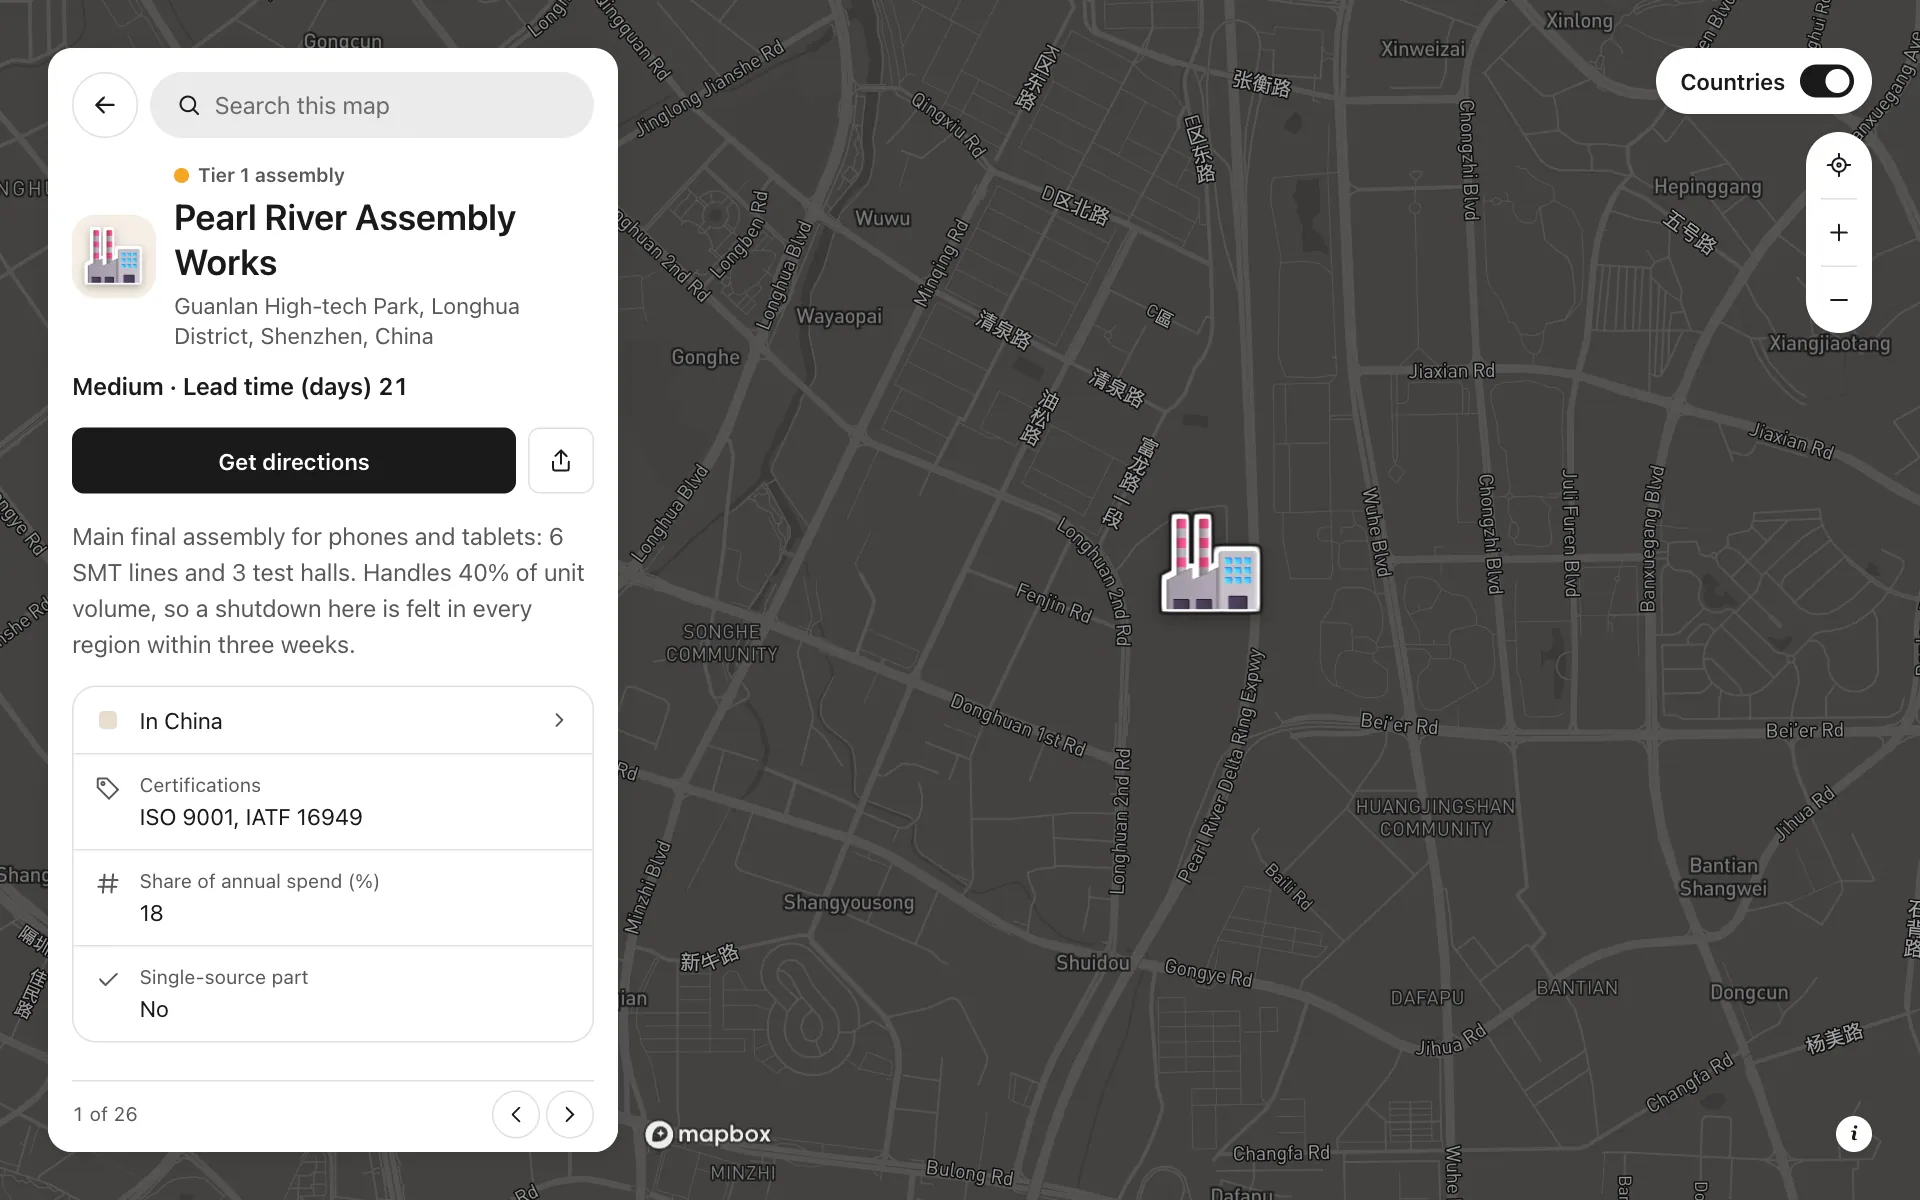
Open any place on the map to see its details and buttons.
Make one like it in an afternoon
You don't need a developer. These are the four steps, in Create Mappins.
Step 1
Create a guide map and add four categories: Tier 1 assembly, Tier 2 components, Raw materials, and Ports and logistics.
Step 2
Add fields for lead time and share of spend (numbers), risk (a choice), certifications (several choices) and single-source part (yes or no), and turn on filters.
Step 3
Import your supplier list from a CSV or Excel file, or add each site by address, then set each one's category and field values.
Step 4
Choose a dark base, set the opening view, and share the link with finance and your leadership team.
More maps like this
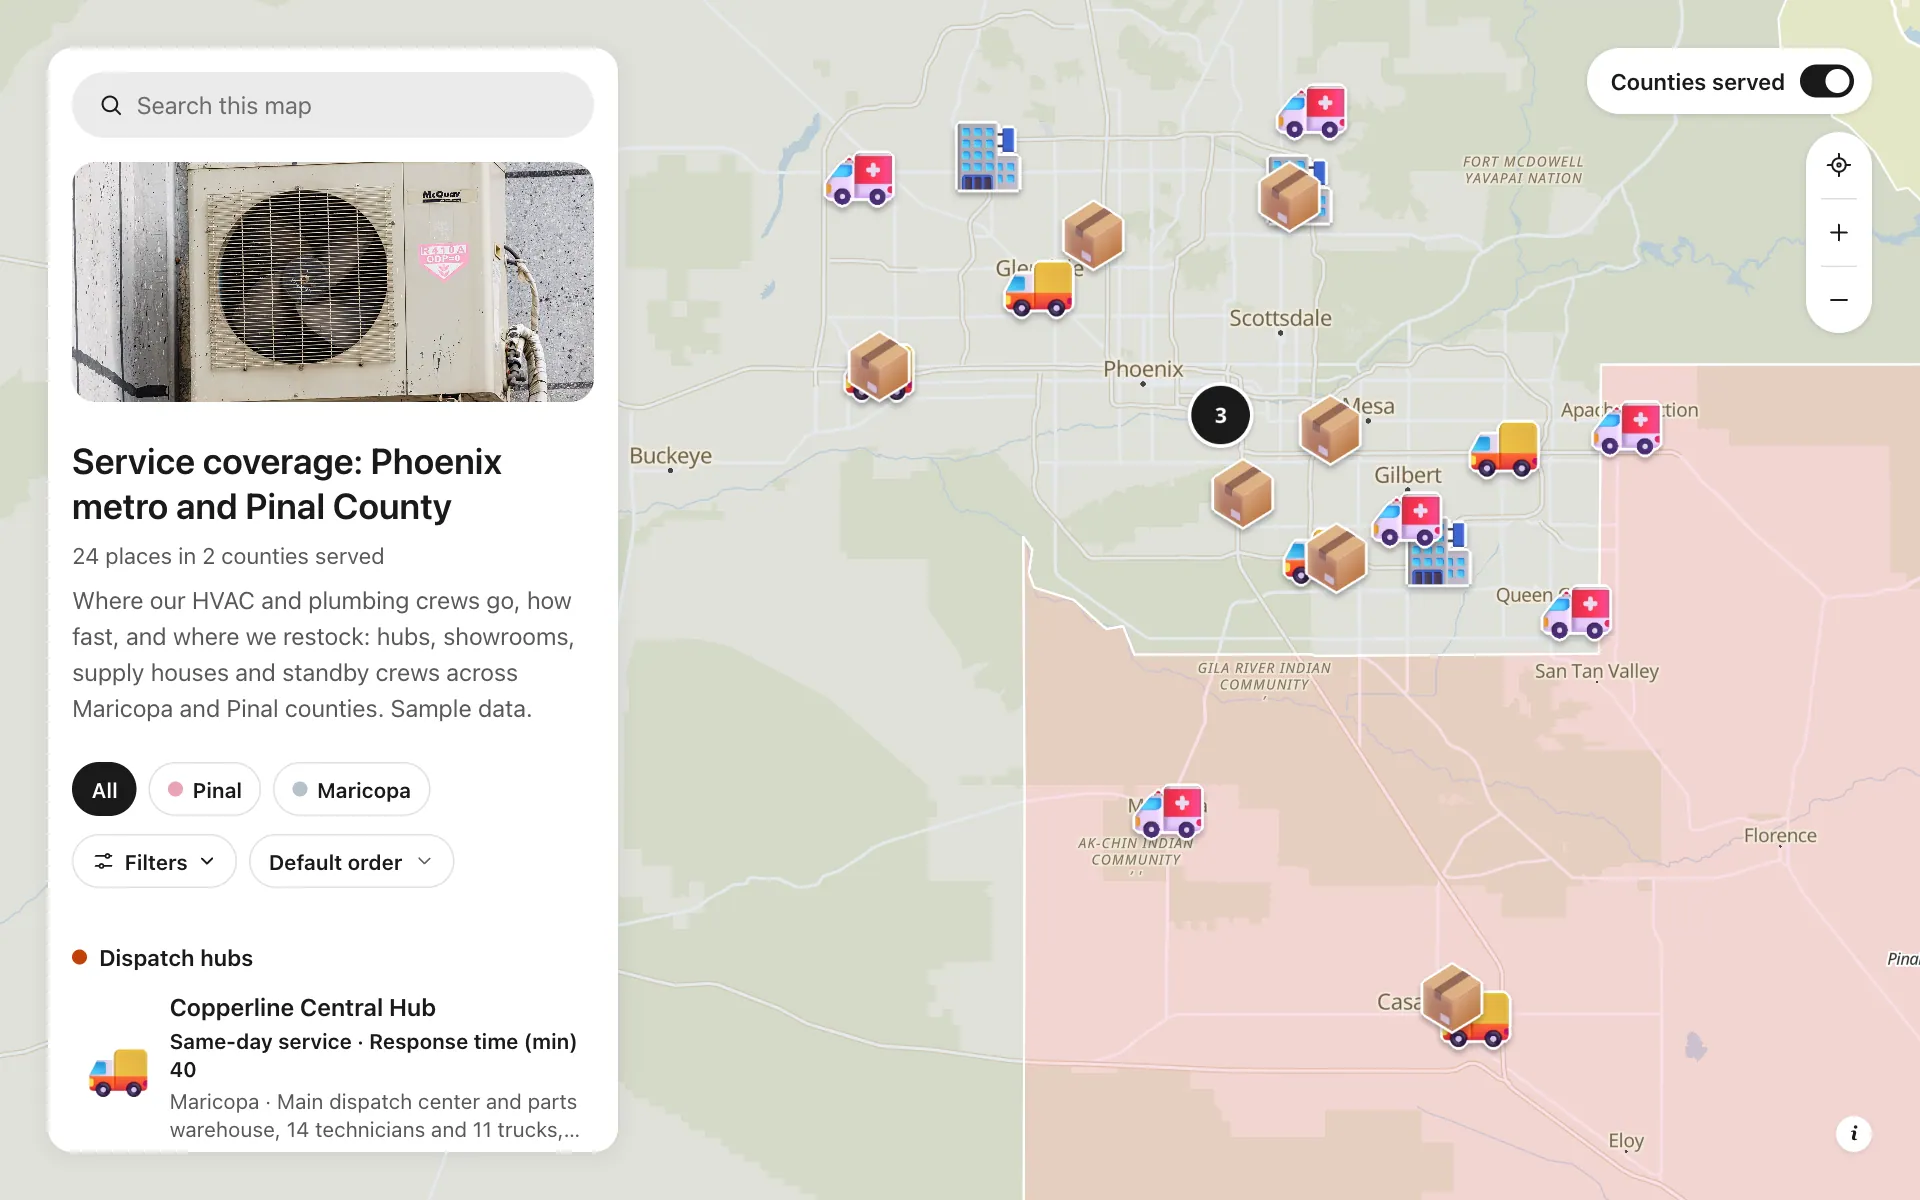
Service area and dispatch map
Dispatch hubs, same-day zones, supply houses and standby crews, shown on one coverage map.
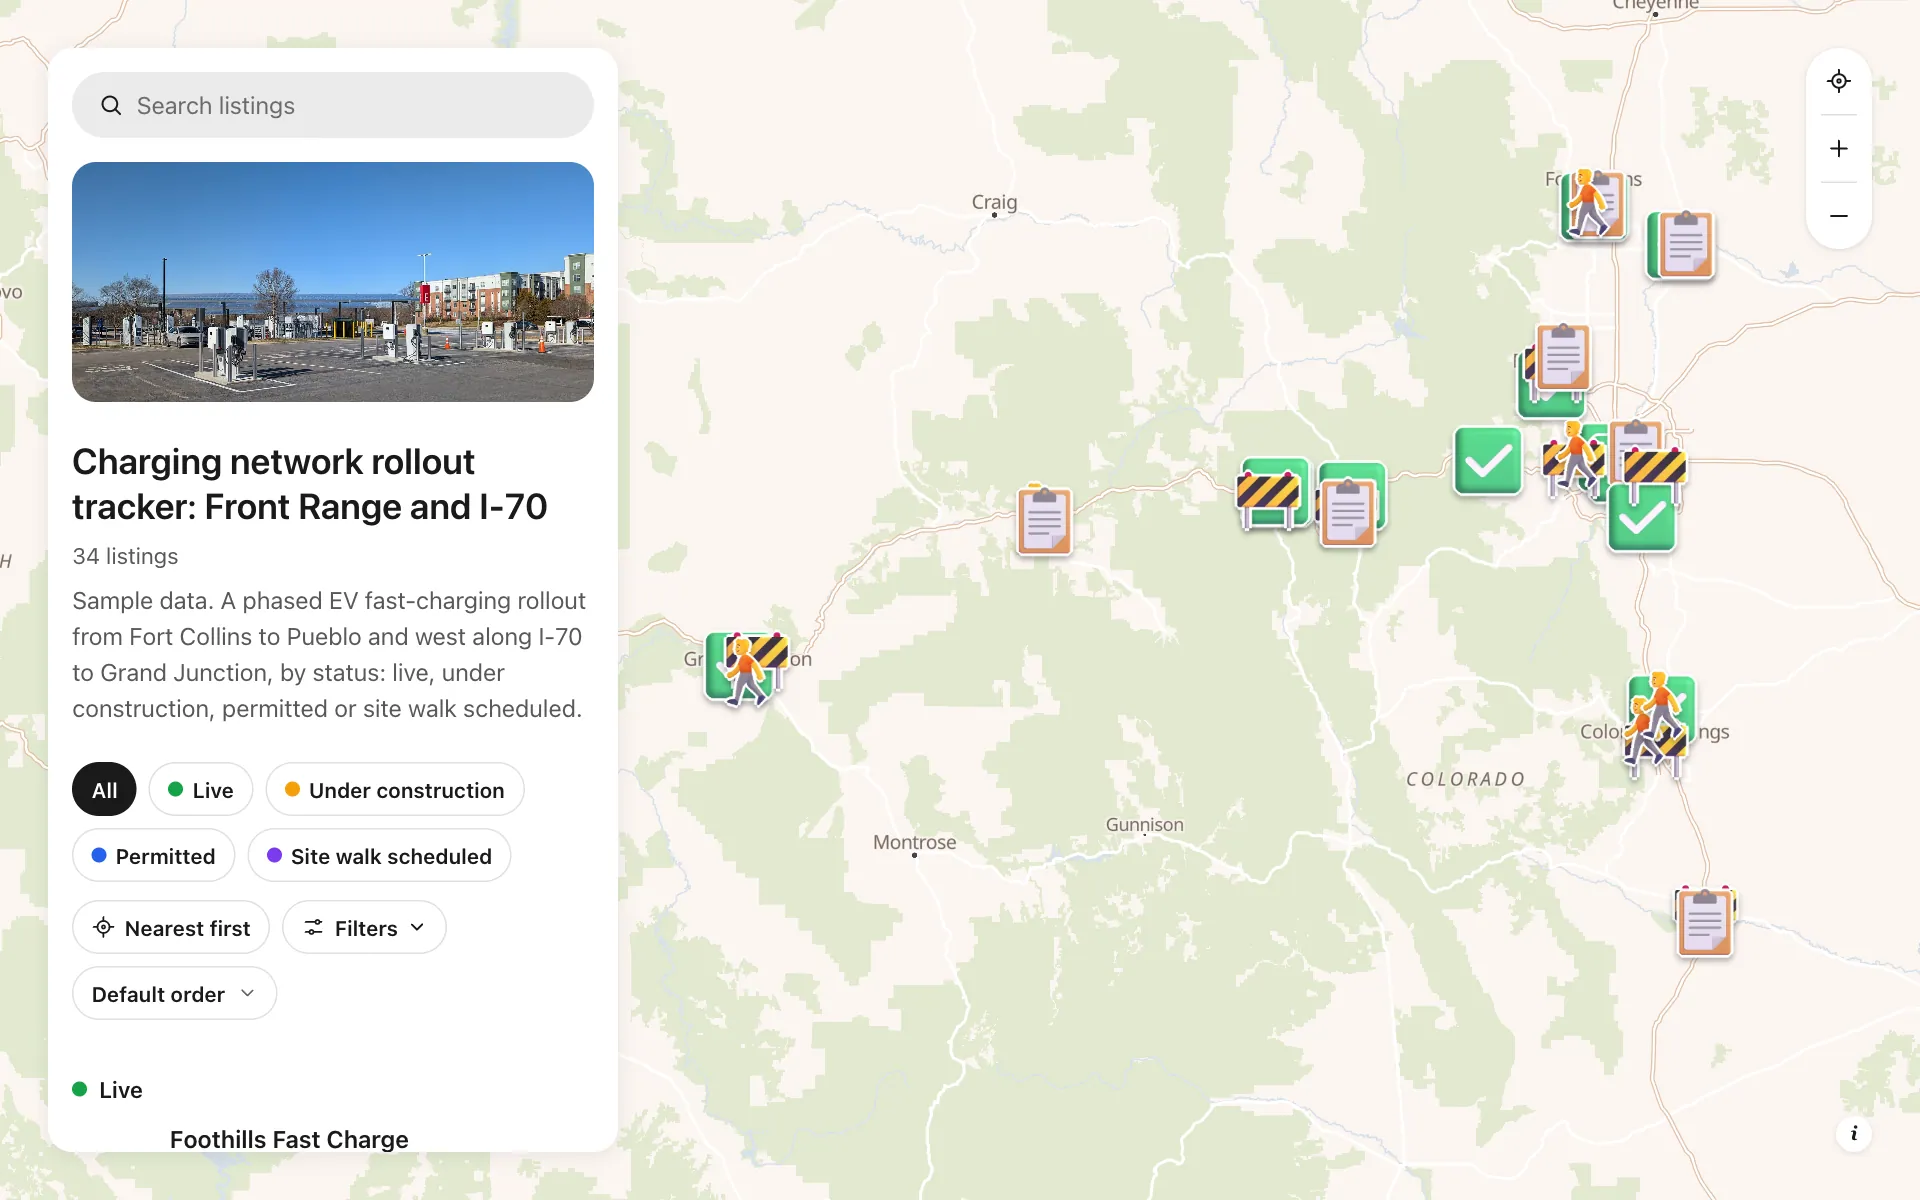
EV charging rollout tracker
34 sites from Fort Collins to Grand Junction by status, power, stalls and host type, with a host contact line.
Cold chain network
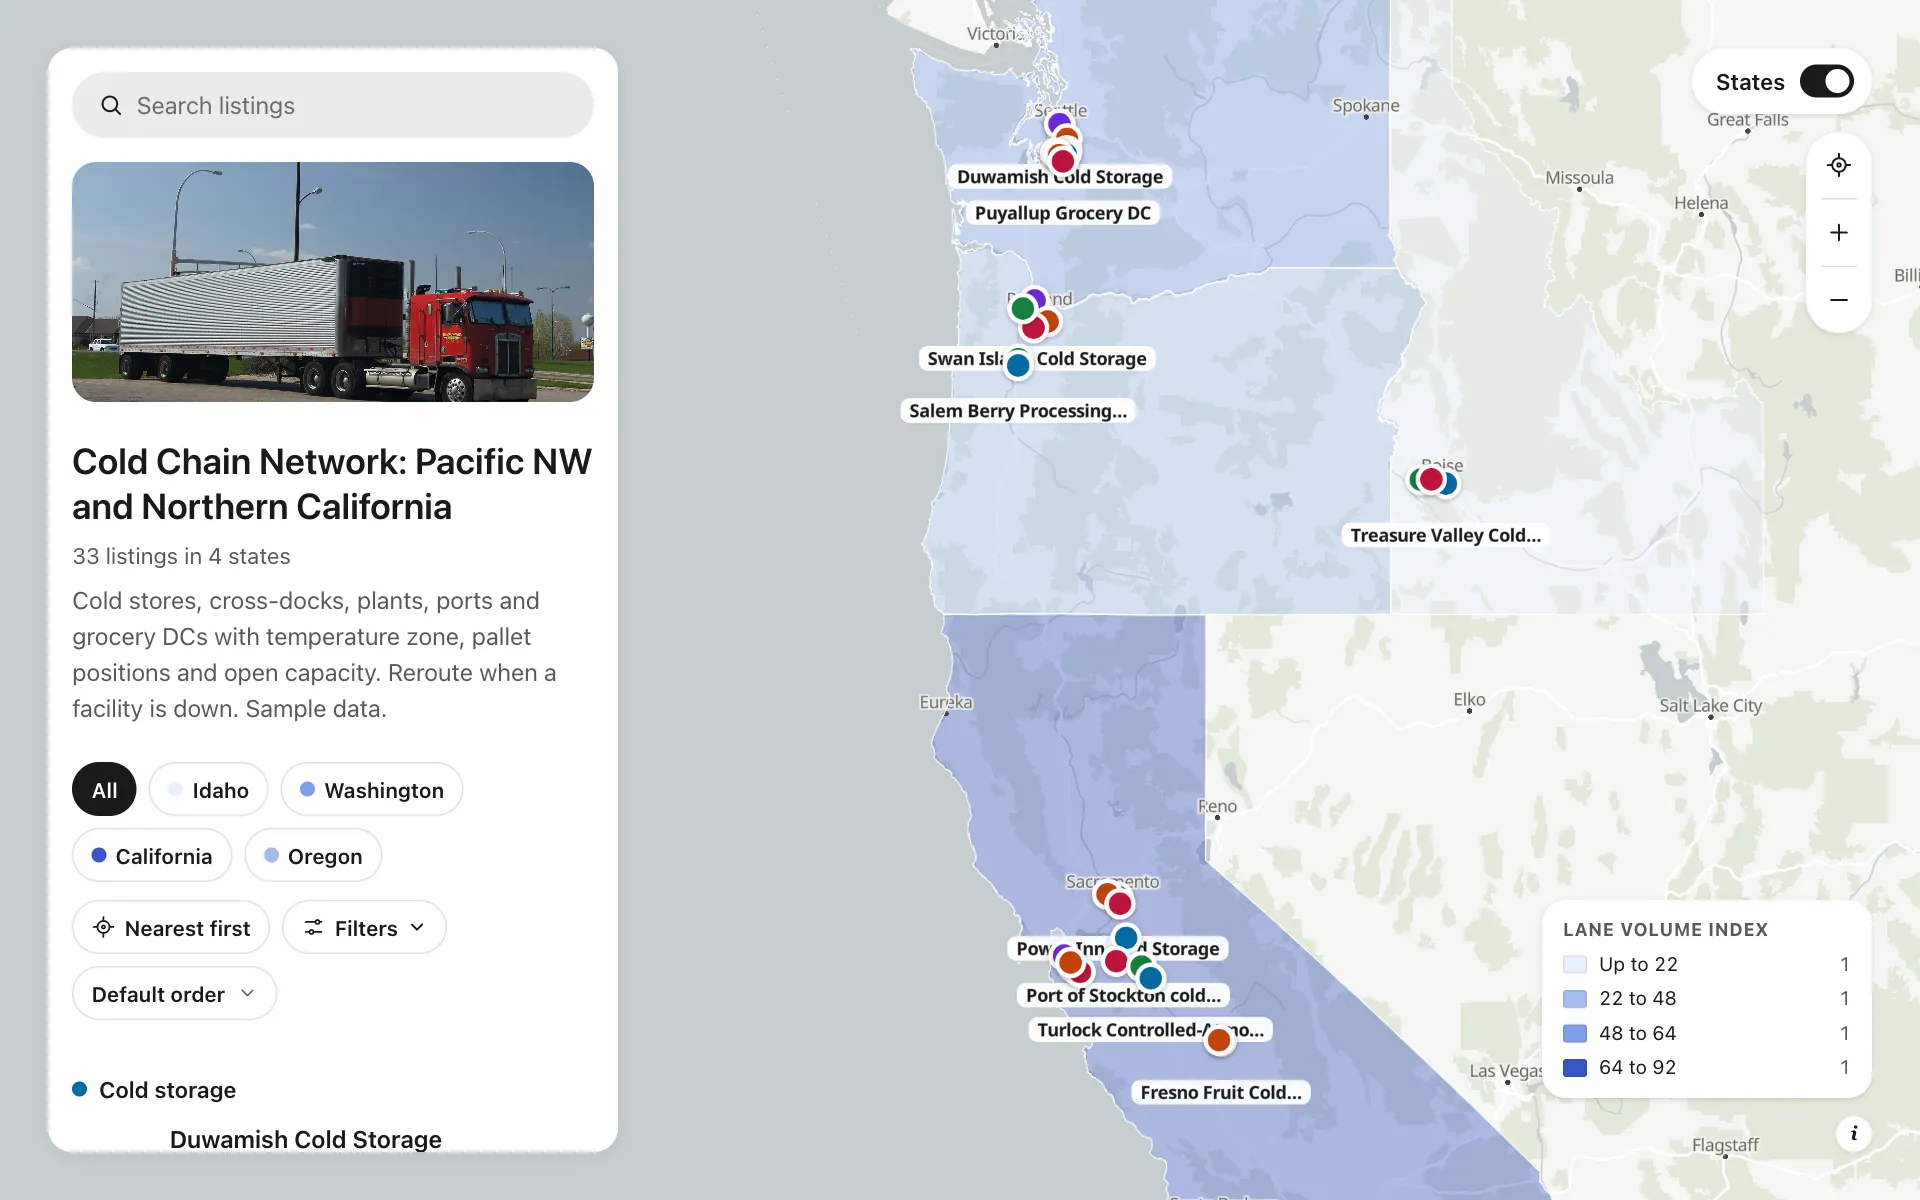
Cold stores, cross-docks, plants and DCs by temperature zone and open capacity, with a Check capacity button.
Build the map your business needs
Start free: up to 3 maps. Import your own data, add photos and details, and share one link.