EV charging rollout tracker
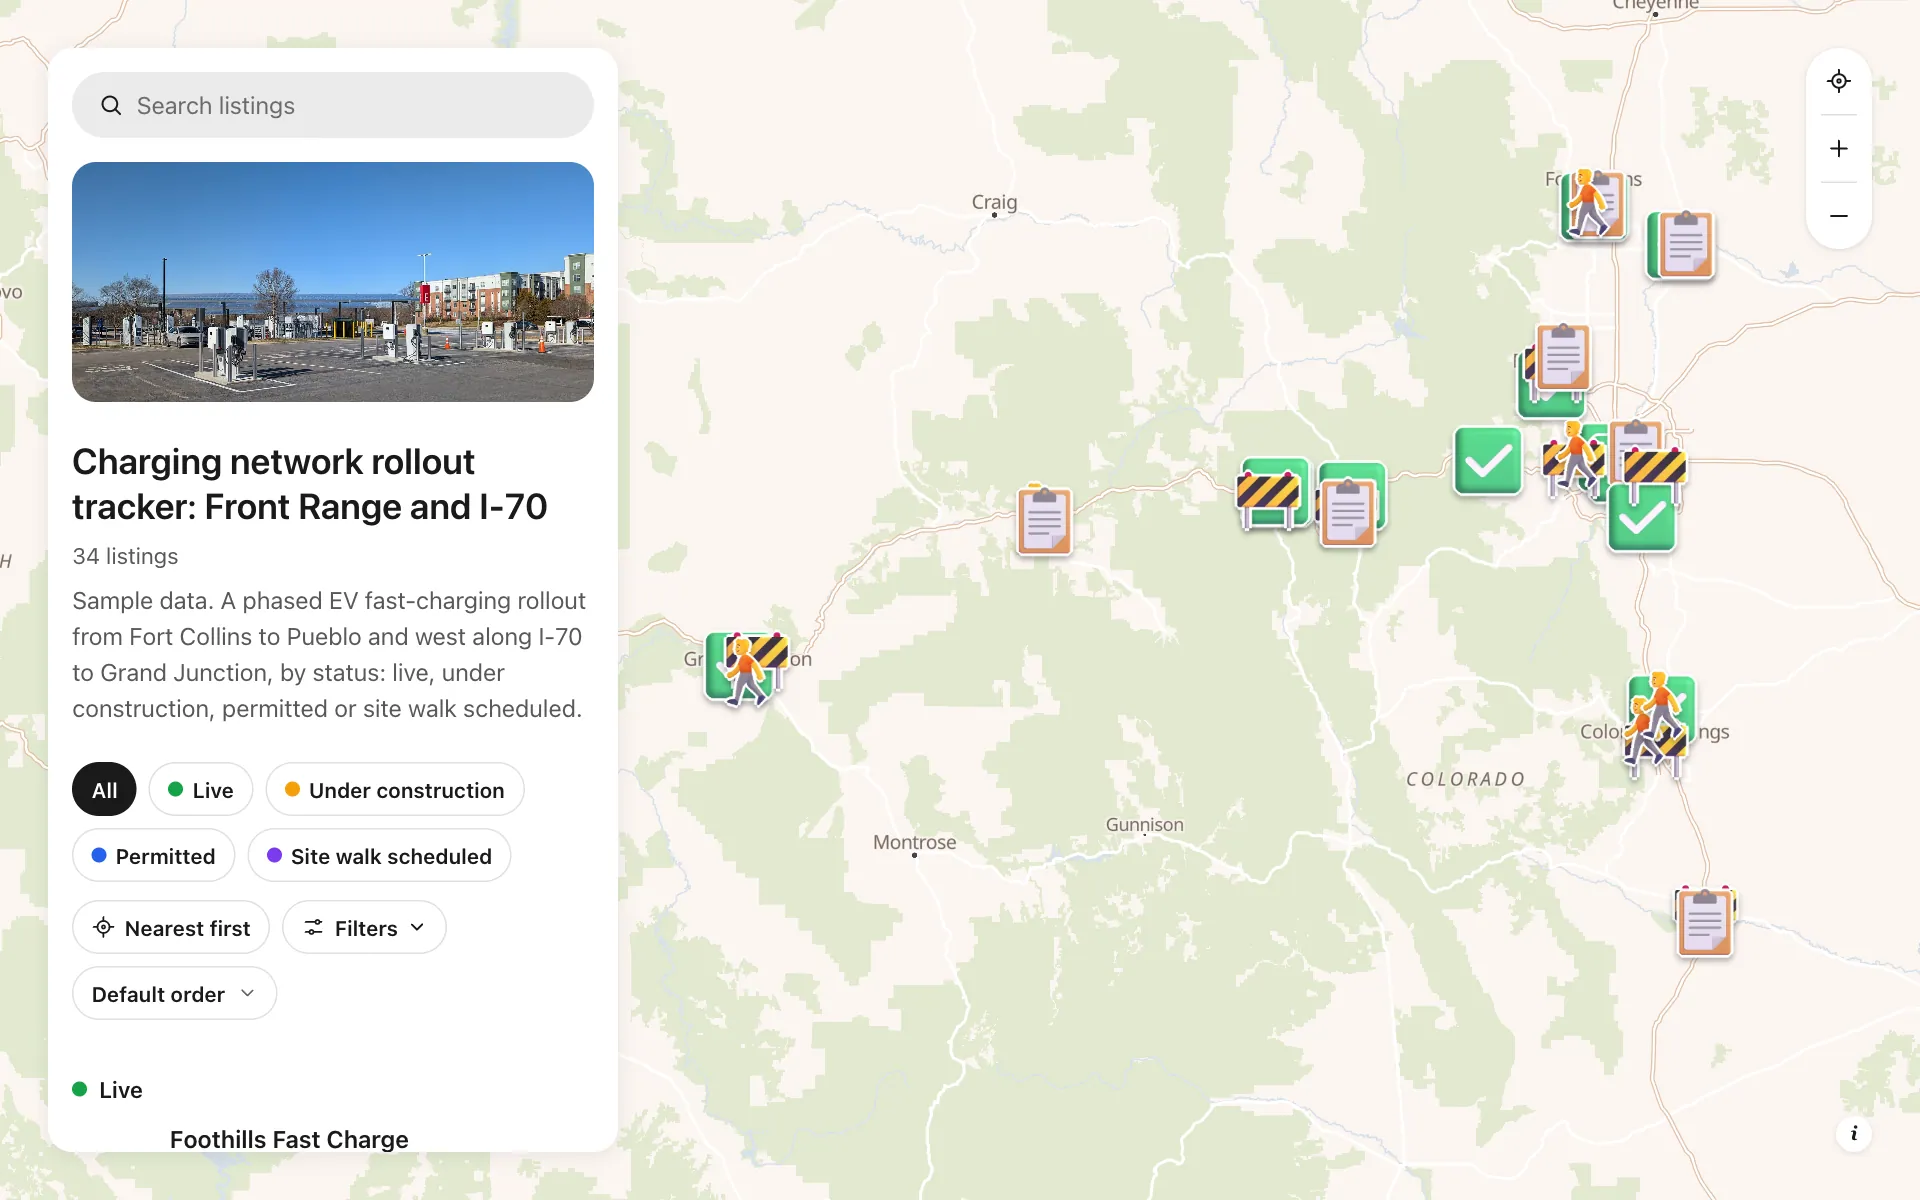
A charging operator's rollout in one map: 34 sites along the Front Range and I-70, each marked live, under construction, permitted or site walk scheduled. Every site lists its power per stall, number of stalls, host type, target open date and make-ready notes. Boards and grant funders filter by status or power, prospective hosts see their neighbors already built, and a Host inquiries button rings the right regional line. Update one pin and everyone sees it.
A sample map: its businesses and people are invented.
Who needs a map like this
Who it’s for
EV charging operators, utilities and cities that build sites in phases
What it’s worth
Grant reports and host-site sales both turn on a clear status map. One map that stays current replaces status slides that are stale by the time they are sent, so funders, boards and host businesses see where each site stands.
What to notice in this map
- Four status stickers read at a glance: green plug live, amber construction, blue permit, purple site walk
- Filter by power per stall to show only 350 kW sites
- Filter by number of stalls and host type: grocery, shopping center, municipal
- Target open date on every site, sortable for grant milestones
- A Host inquiries button that calls the Front Range, Southern Colorado or Western Slope line
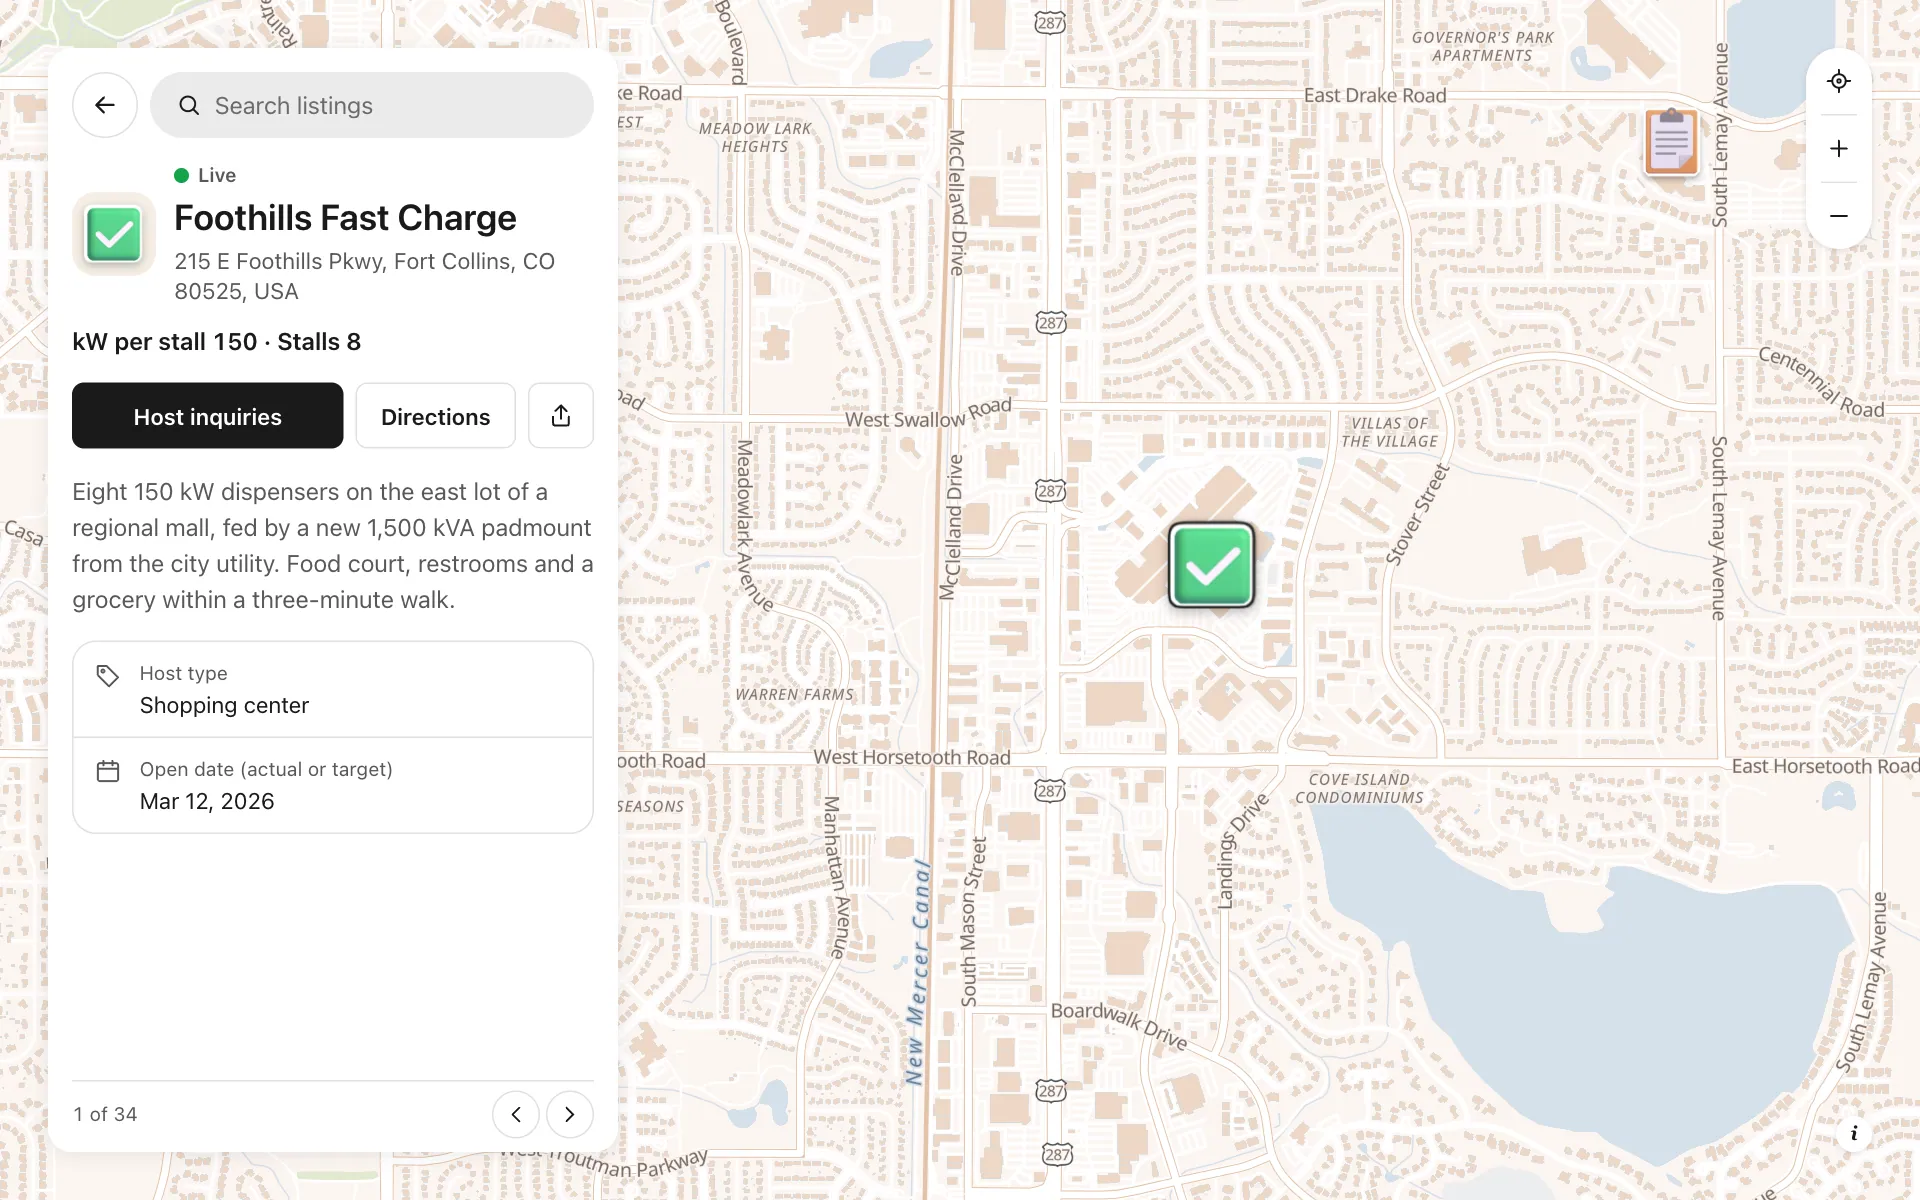
Open any place on the map to see its details and buttons.
Make one like it in an afternoon
You don't need a developer. These are the four steps, in Create Mappins.
Step 1
Create a directory map and add the four status categories, each with its own color and sticker.
Step 2
Add number fields for power per stall and number of stalls, a choice field for host type, and a date field for the target open date, with filters switched on.
Step 3
Import or search each site by address, then set its status and fill in the fields and a description of its make-ready progress.
Step 4
Add a phone field with a Host inquiries button, then share the map by link or embed it in your grant reports and host pitch deck.
More maps like this
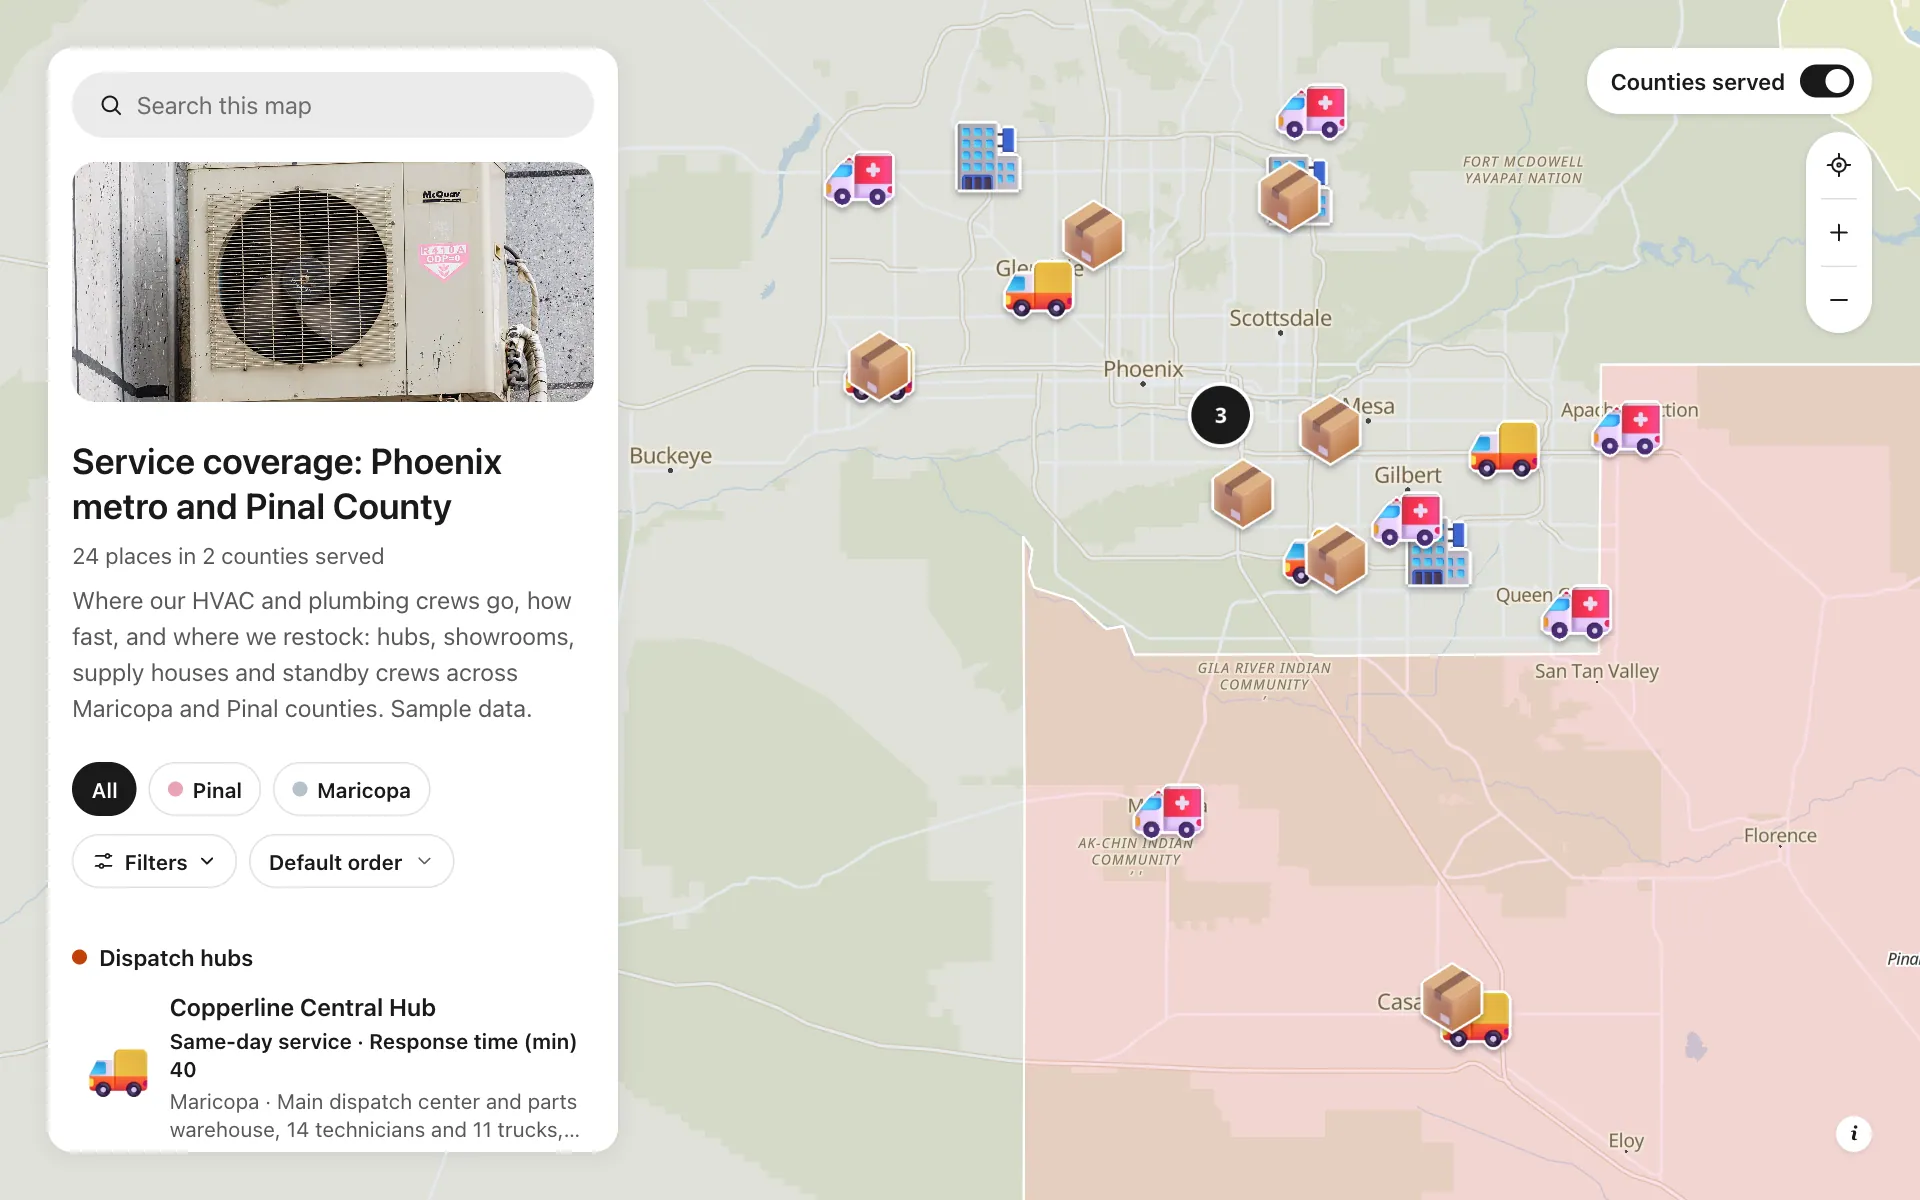
Service area and dispatch map
Dispatch hubs, same-day zones, supply houses and standby crews, shown on one coverage map.
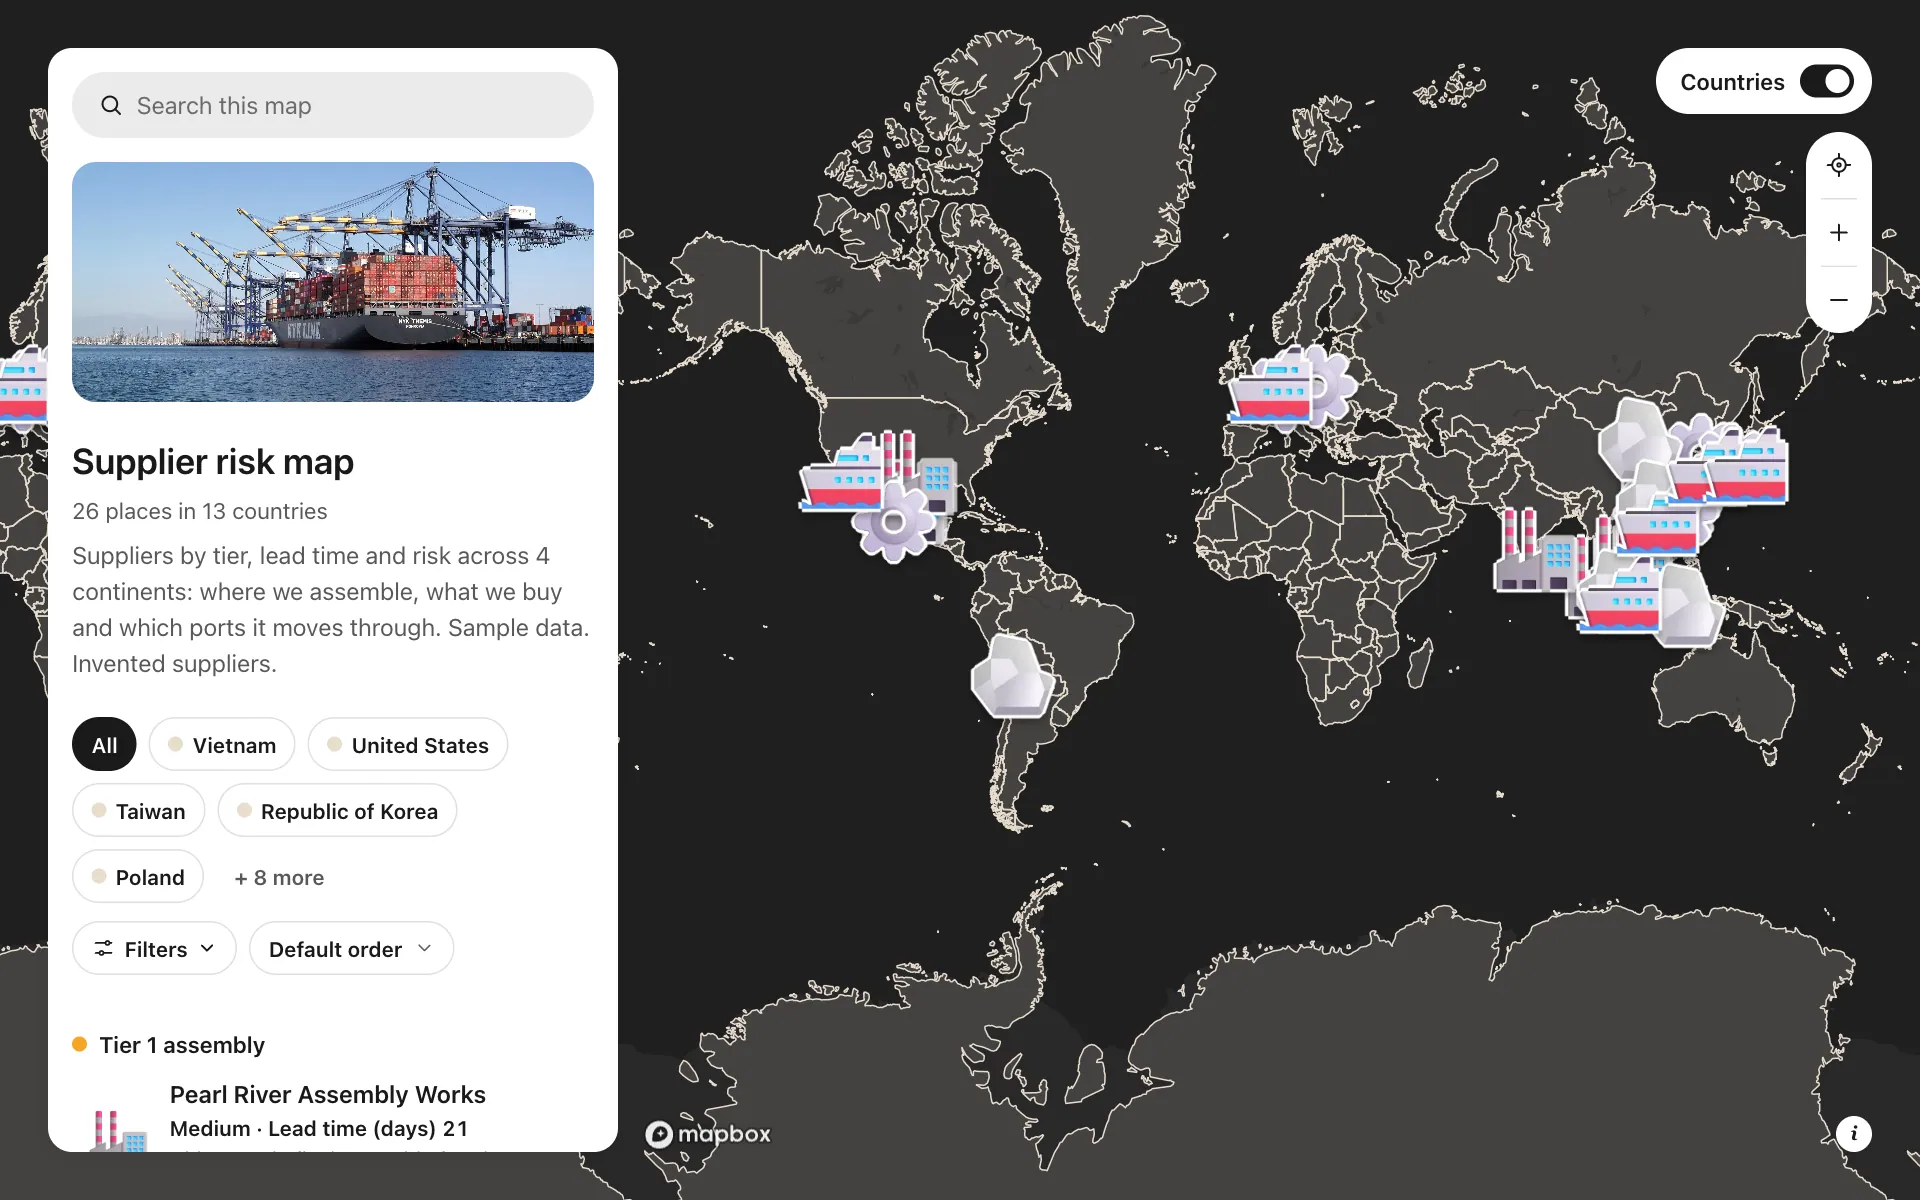
Supplier risk map
Suppliers by tier, lead time and risk, so concentration shows at a glance.
Cold chain network
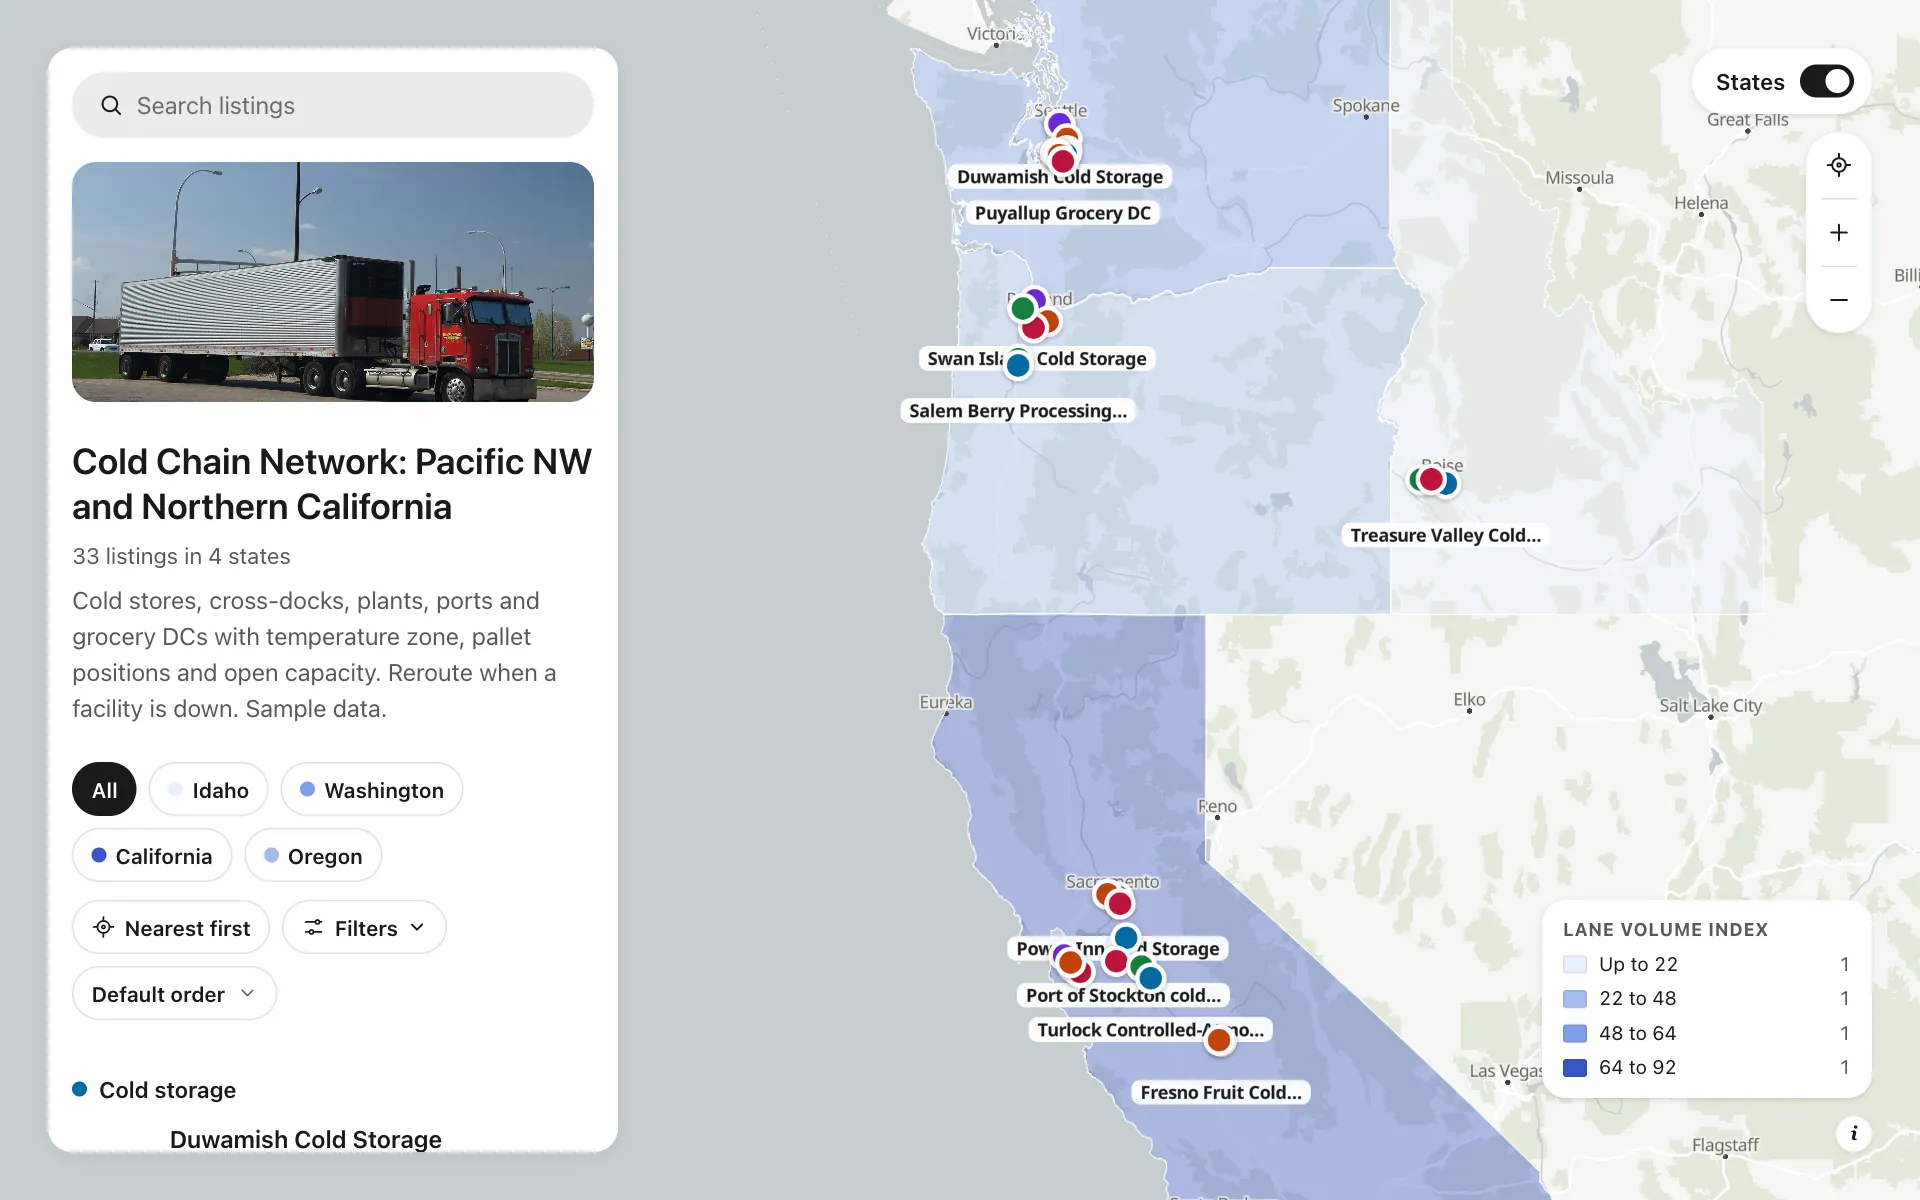
Cold stores, cross-docks, plants and DCs by temperature zone and open capacity, with a Check capacity button.
Build the map your business needs
Start free: up to 3 maps. Import your own data, add photos and details, and share one link.