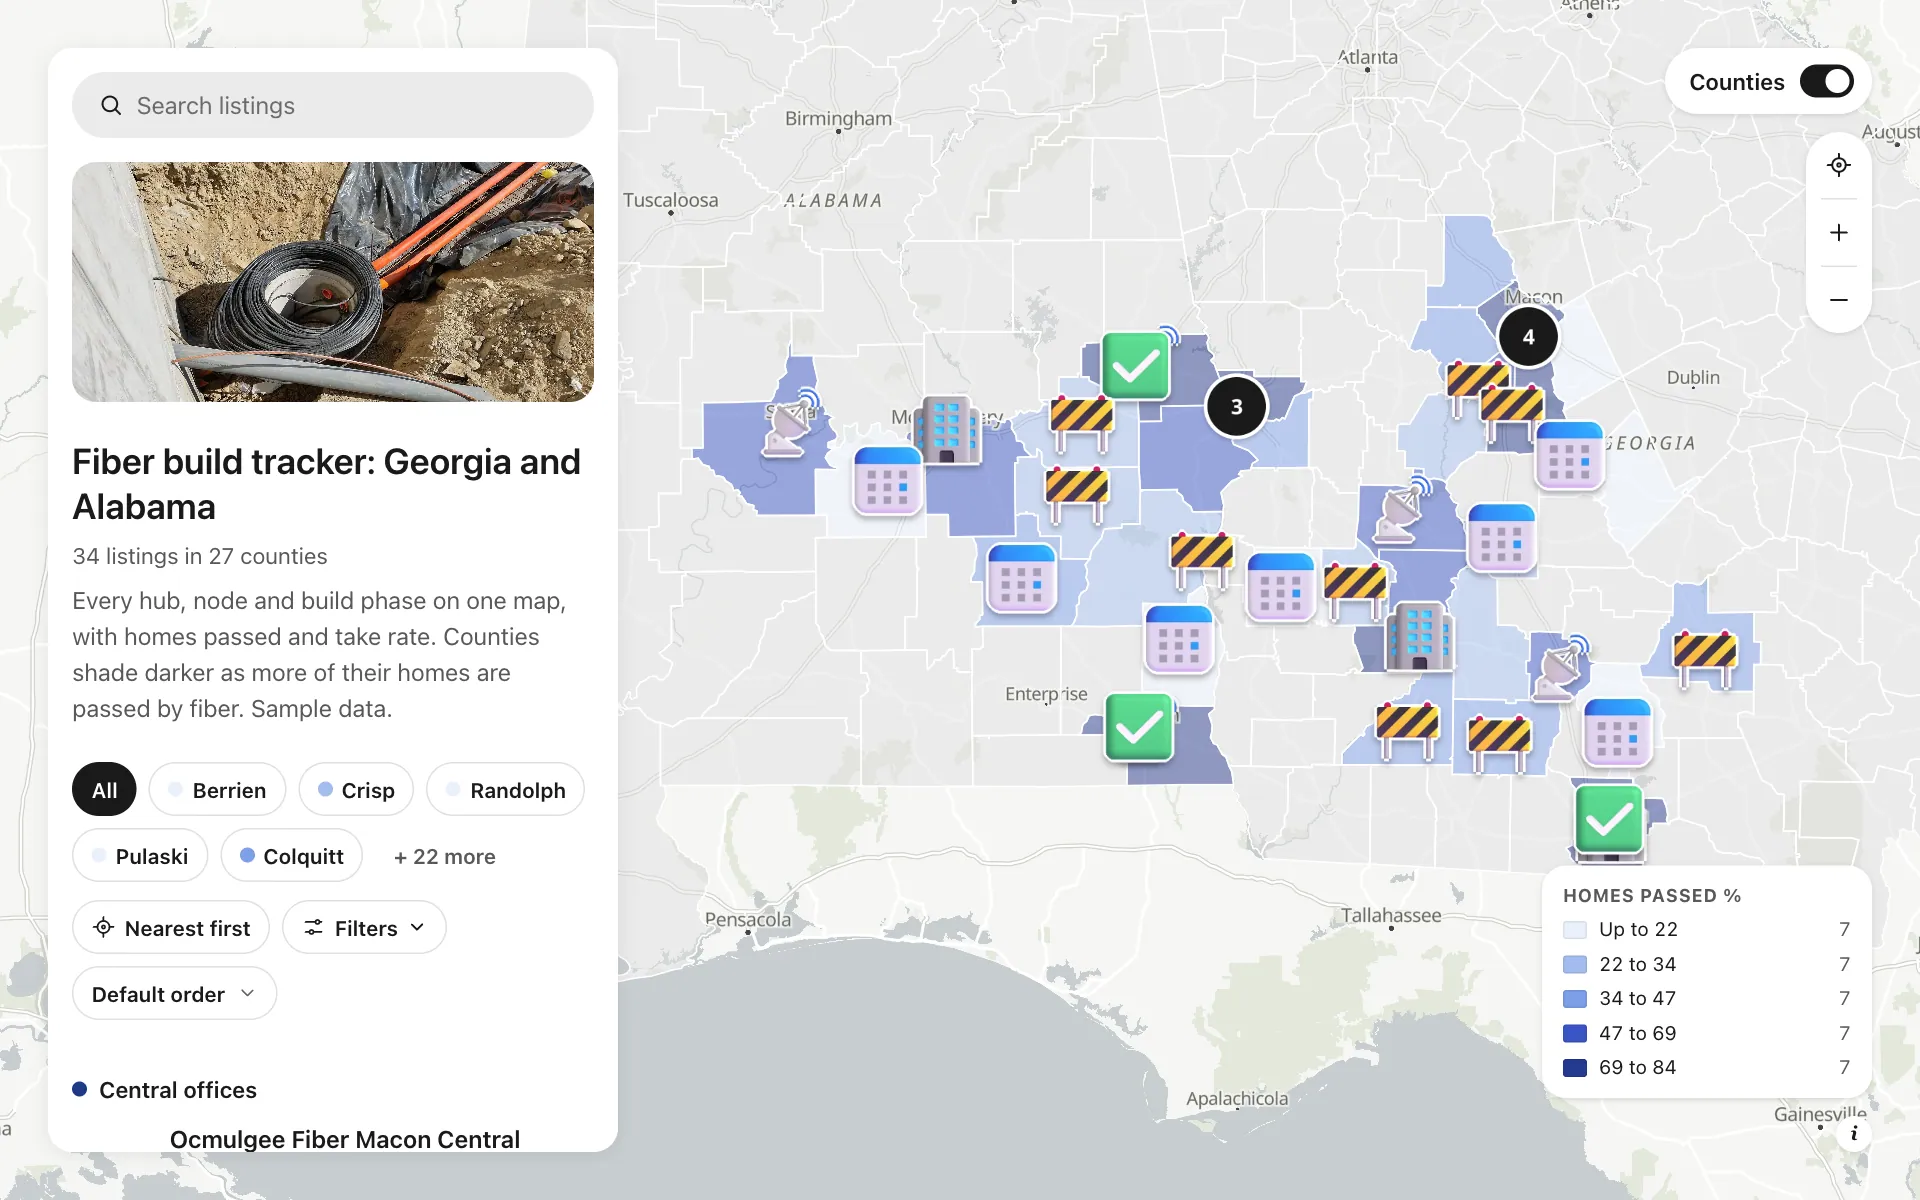
Fiber build tracker
A build tracker for invented fiber operators working across rural Georgia and Alabama. Five central offices, six hubs and ten active build nodes sit beside six sold-out nodes and seven planned ones, on counties shaded by the share of homes passed. Filter by build phase, funding source, homes passed or take rate, and see each node's target completion date. Lenders and county boards get one link instead of a weekly deck, and a button lets a resident check their address.
A sample map: its businesses and people are invented.
Who needs a map like this
Who it’s for
Broadband operators, ISPs, consultants and county governments tracking BEAD and grant-funded fiber builds
What it’s worth
Grants pay on milestones and lenders want proof. One live map of every hub, node and build phase, with homes passed and take rate by county, replaces the weekly status deck and tells sales which nodes to knock on first.
What to notice in this map
- Counties shaded by the share of homes passed, with a legend
- Build phase filter: Live, Construction, Design, Planned
- Homes passed and take rate as ranges you can filter and sort
- Funding choice (BEAD, state grant, private) on every site
- A Check my address button on each node
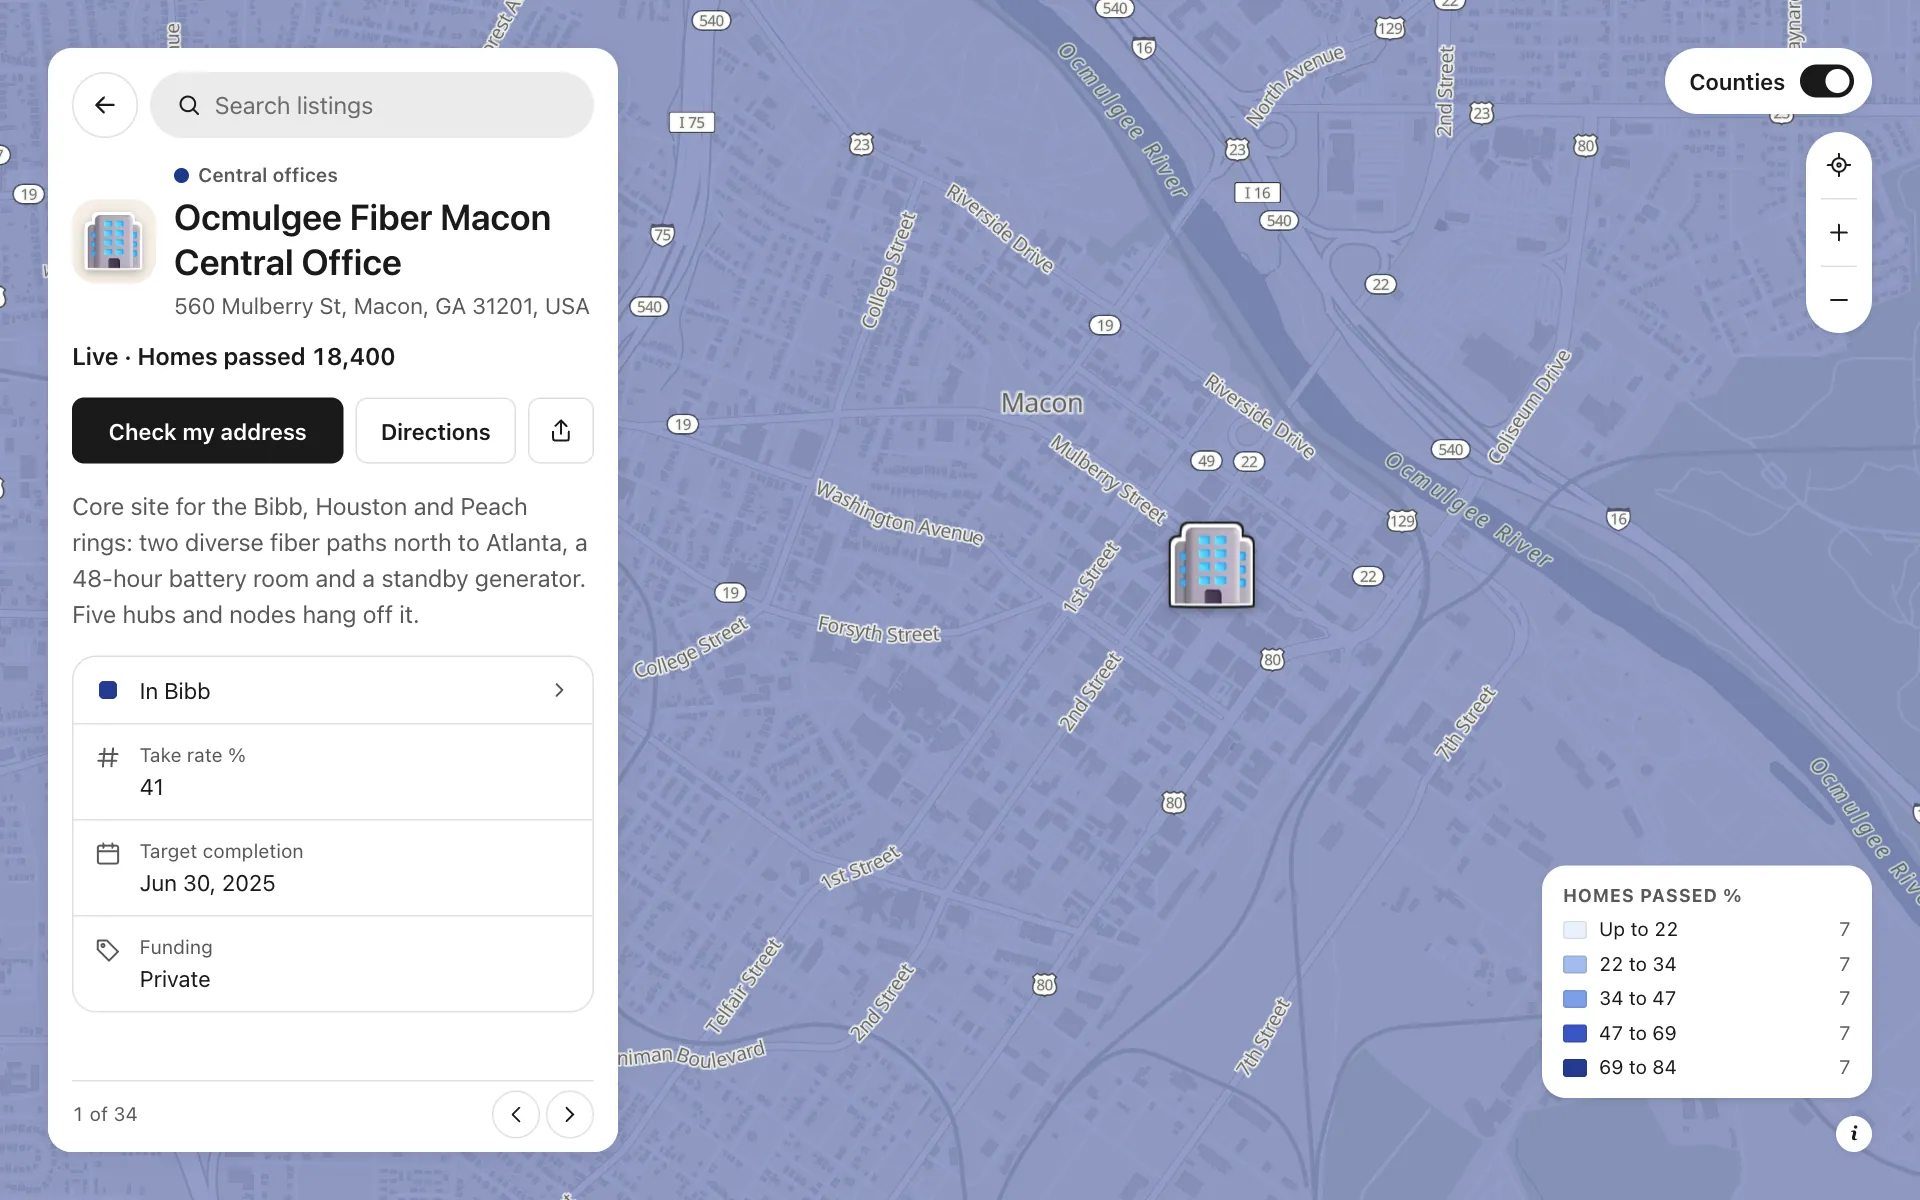
Open any place on the map to see its details and buttons.
Make one like it in an afternoon
You don't need a developer. These are the four steps, in Create Mappins.
Step 1
Create a directory map and add your central offices, hubs and nodes as places, in five categories.
Step 2
Add fields: build phase and funding as choices, homes passed and take rate as numbers, target completion as a date, and a link field with the button label Check my address.
Step 3
Open the data library, add the US counties layer for Georgia and Alabama, write a Homes passed % column per county and shade by it at about 50% opacity.
Step 4
Pick the grey base style, set where it opens, then publish and share the link with lenders, county staff and your sales team.
More maps like this
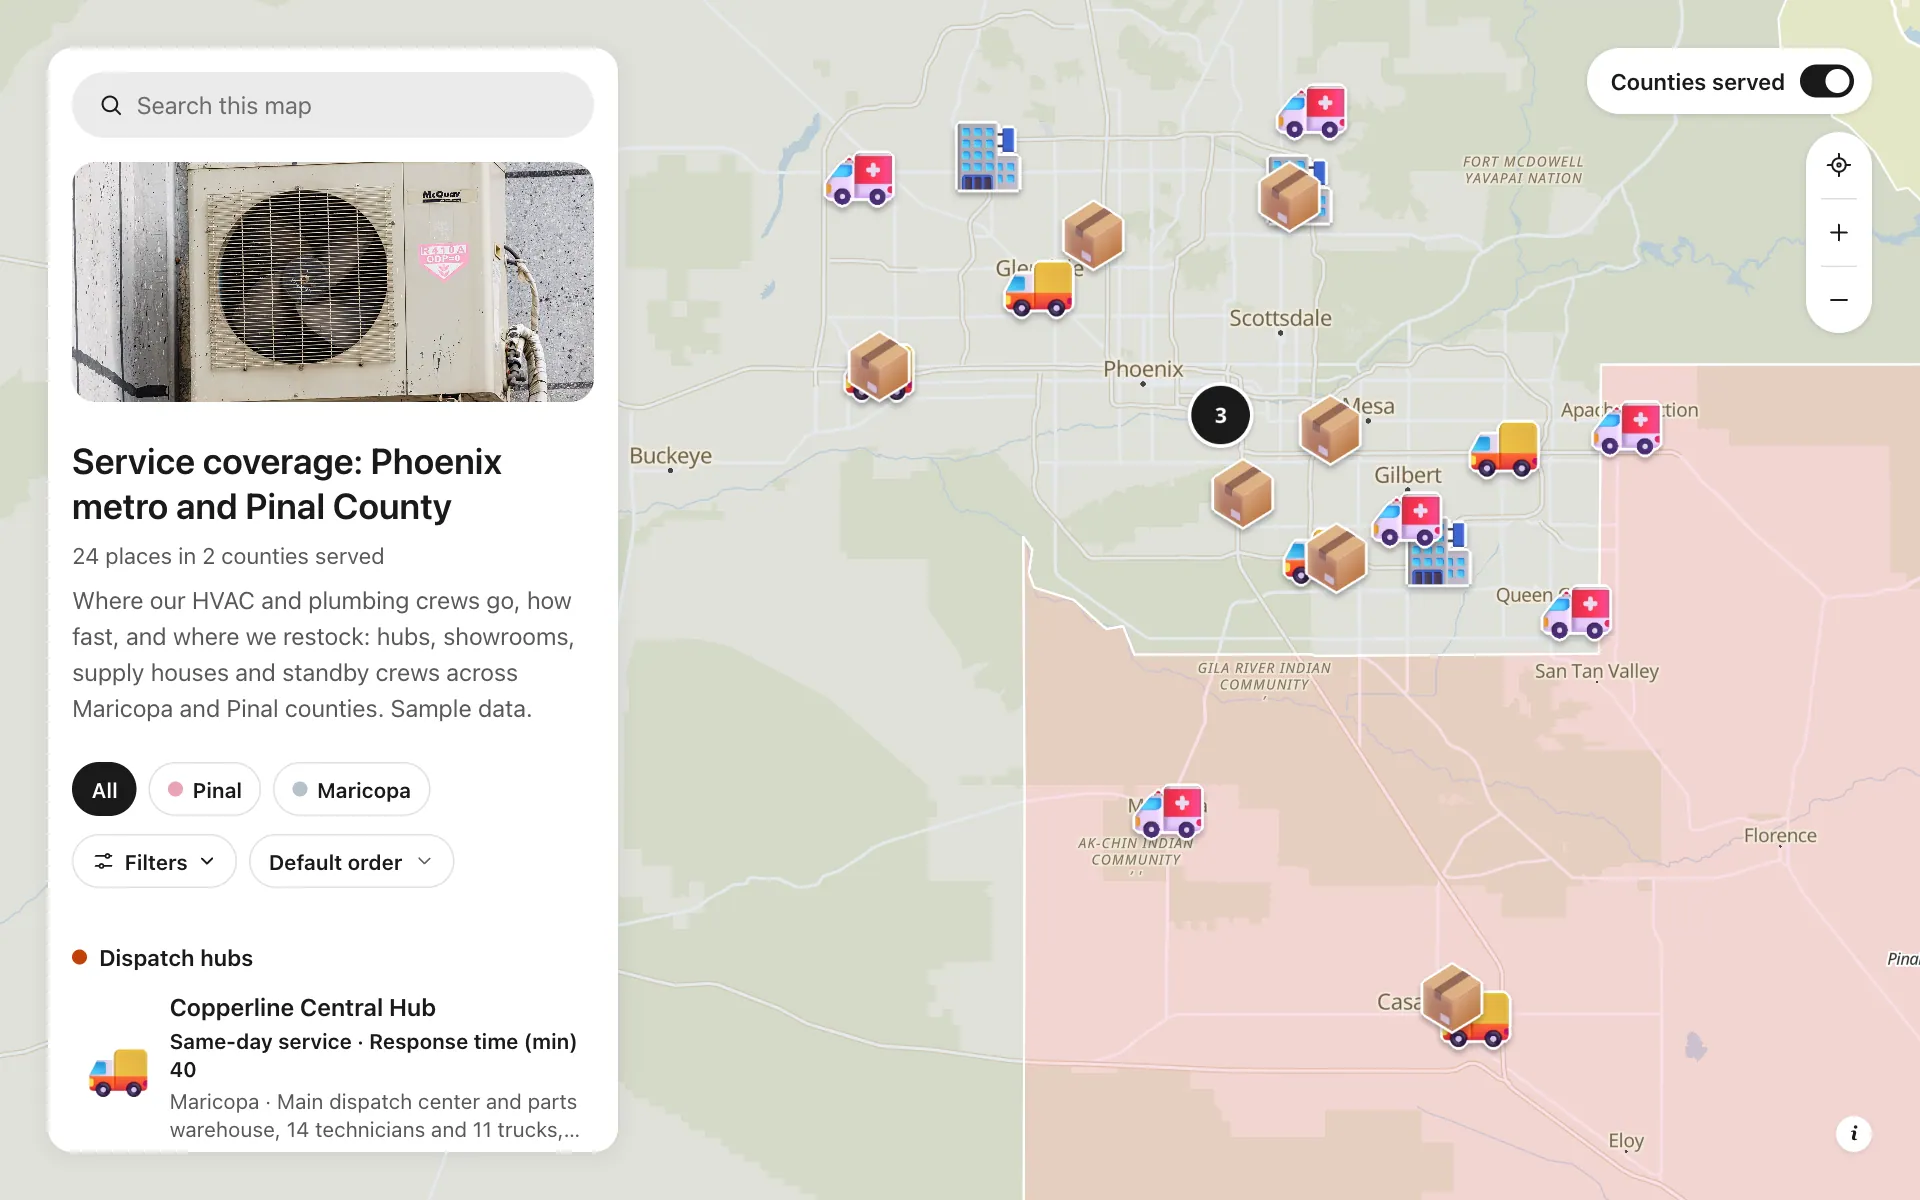
Service area and dispatch map
Dispatch hubs, same-day zones, supply houses and standby crews, shown on one coverage map.
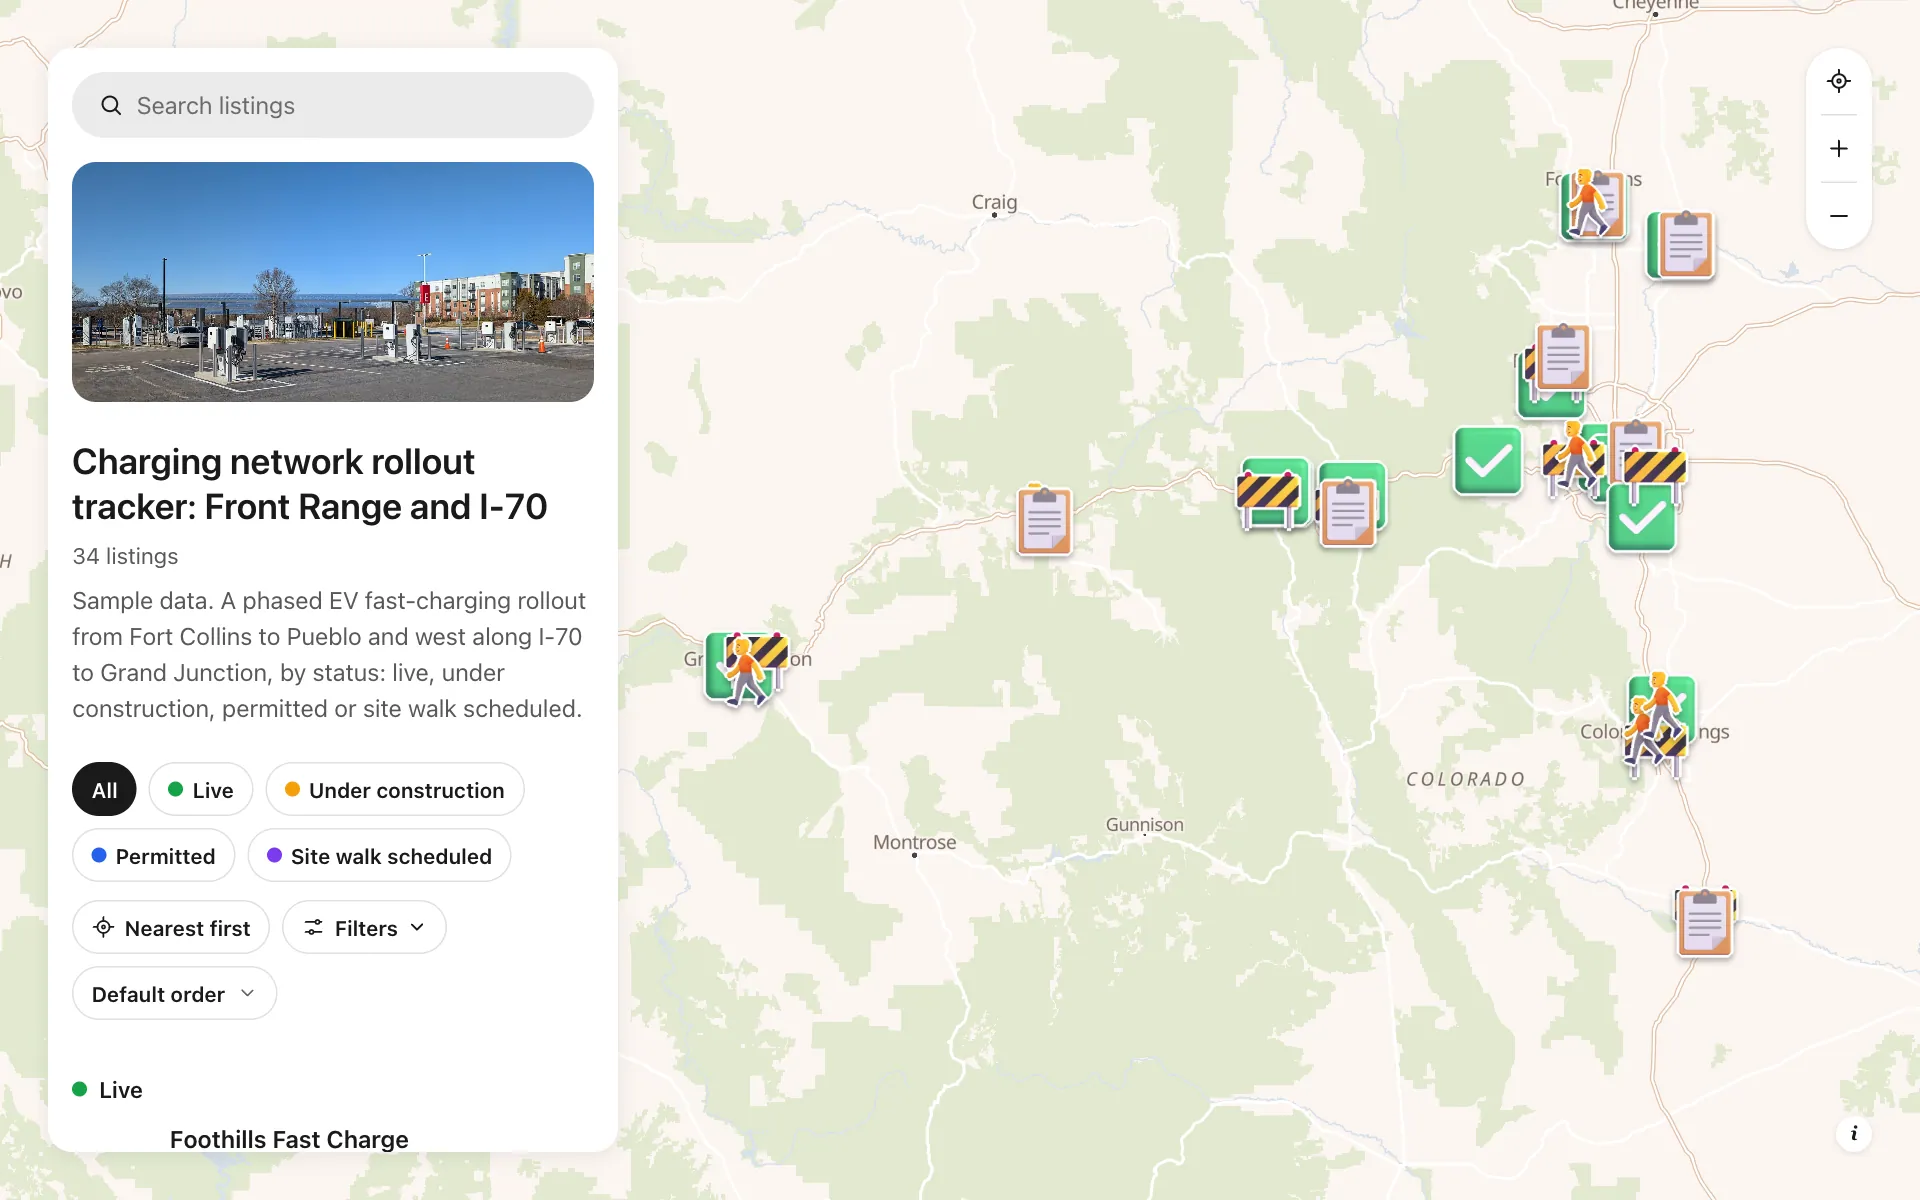
EV charging rollout tracker
34 sites from Fort Collins to Grand Junction by status, power, stalls and host type, with a host contact line.
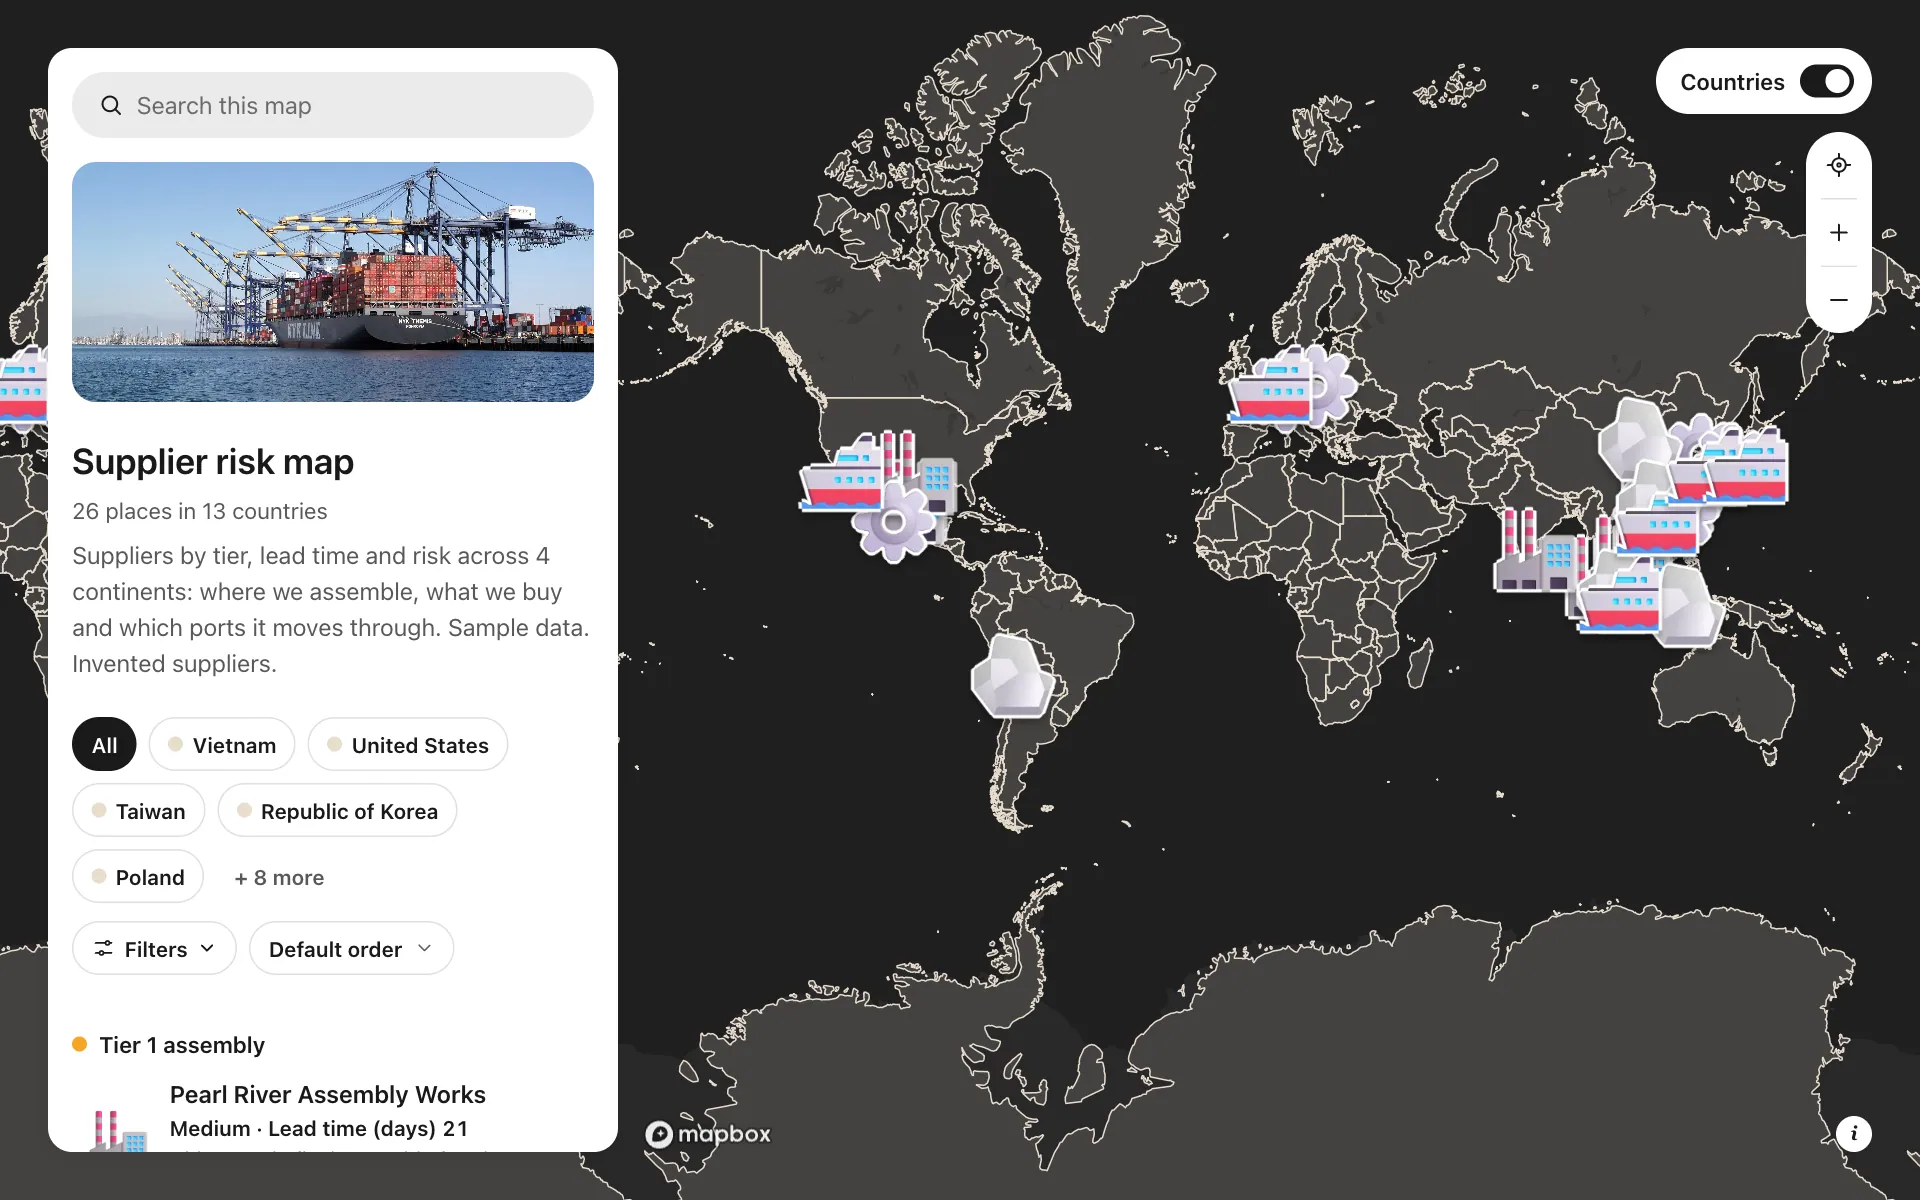
Supplier risk map
Suppliers by tier, lead time and risk, so concentration shows at a glance.
Build the map your business needs
Start free: up to 3 maps. Import your own data, add photos and details, and share one link.